Download

1 / 43
430 likes | 560 Vues
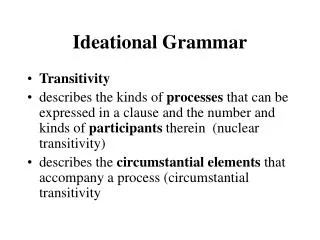
This Pump Sucks: Testing Transitivity with Individual Data. Michael H. Birnbaum and Jeffrey P. Bahra California State University, Fullerton. Transitivity of Preference. If A > B and B > C then A > C. Satisfy it or become a money pump. But transitivity may not hold if data contain “error.”

E N D
This Pump Sucks: Testing Transitivity with Individual Data Michael H. Birnbaum and Jeffrey P. Bahra California State University, Fullerton
Transitivity of Preference • If A > B and B > C then A > C. • Satisfy it or become a money pump. • But transitivity may not hold if data contain “error.” • And different people might have different “true” preferences.
Tversky (1969) • Tversky (1969) reported that selected subjects showed a pattern of intransitive data consistent with a lexicographic semi-order. • Tversky tested Weak Stochastic Transitivity: If P(A>B) > 1/2 and P(B>C) > 1/2 then P(A>C) > 1/2.
Issues • Iverson & Falmagne (1985) argued that Tversky’s statistical analysis was incorrect of WST. • Tversky went on to publish transitive theories of preference (e.g., CPT).
Renewed Interest in Intransitive Preference • New analytical methods for analysis of transitivity (Iverson, Myung, & Karabatsos; Regenwetter & Stober, et al); Error models (Sopher & Gigliotti, ‘93; Birnbaum, ‘04; others). • Priority Heuristic (Brandstaetter, et al., 2006); stochastic difference model (González-Vallejo, 2002;similarity judgments, Leland, 1994; majority rule, Zhang, Hsee, Xiao, 2006). Renewed interest in Fishburn, as well as in Regret Theory.
Lexicographic Semi-order • G = (x, p; y, 1 - p). F = (x’, q; y’, 1 - q). • If y - y’ ≥ DL choose G (DL = $10) • If y’ - y ≥ DL choose F • If p - q ≥ DP choose G (DP = 0.1) • If q - p ≥ DP choose F • If x > x’ choose G; if x’ > x choose F; • Otherwise, choose randomly.
Priority Heuristic • “Aspiration level” is 10% of largest prize, rounded to nearest prominent number. • Compare gambles by lowest consequences. If difference exceeds the aspiration level, choose by lowest consequence. • If not, compare probabilities; choose by probability if difference ≥ 0.1 • Compare largest consequences; choose by largest consequences.
New Studies of Transitivity • Work currently under way testing transitivity using same procedures as used in other decision research. • Participants view choices via the WWW, click button beside the gamble they would prefer to play. • Today’s talk: Single-S data.
Studies with Roman Gutierez • Four studies used Tversky’s 5 gambles, formatted with tickets or with pie charts. • Studies with n = 417 and n = 327 with small or large prizes ($4.50 or $450) • No pre-selection of participants. • Participants served in other risky DM studies, prior to testing (~1 hr).
Three of Tversky’s (1969) Gambles • A = ($5.00, 0.29; $0, 0.79) • C = ($4.50, 0.38; $0, 0.62) • E = ($4.00, 0.46; $0, 0.54) Priority Heurisitc Predicts: A preferred to C; C preferred to E, and E preferred to A.
Findings • Results were surprisingly transitive, unlike Tversky’s data (est. 95% transitive). • Of those 115 who were perfectly reliable, 93 perfectly consistent with EV (p), 8 with opposite ($), and only 1 intransitive. • Differences: no pre-test; Probability represented by # of tickets (100 per urn), rather than by pies; Participants have practice with variety of gambles, & choices;Tested via Computer.
Pies: with or without Numerical probabilities • 321 participants randomly assigned conditions with probabilities displayed as pies (spinner), either with numerical probabilities displayed or without. • Of 105 who were perfectly reliable, 84 were perfectly consistent with EV (prob), 13 with the opposite order ($); 1 consistent with LS.
Findings • Priority Heuristic predicted violations of transitivity were rare and rarely repeated when probability and prize information presented numerically. • Violations of transitivity are still rare but more frequent when probability information presented only graphically. • Evidence of Dimension Interaction violates PH and additive Difference models.
Response to Birnbaum-Gutierrez • Perhaps the intransitivity only develops in longer studies. Tversky used 20 replications of each choice. • Perhaps consequences of Tversky’s gambles diminished since 1969 due to inflation. Perhaps transitivity occurs because those prizes are too small.
Birnbaum & Bahra • Collected up to 40 choices/pair per person. (20 reps). 2 Sessions, 1.5 hrs, 1 week apart. • Cash prizes up to $100. • 51 participants, of whom 10 to win the prize of one of their chosen gambles. • 3 5 x 5 Designs to test transitivity vs. Priority heuristic predictions
Notation-Two-branch Gambles • G = (x, p; y, 1 - p); x > y ≥ 0 • L = Lower Consequence • P = Probability to win higher prize • H = Higher consequence
LH Design • A = ($84, .50; $24) • B = ($88, .50; $20) • C = ($92, .50; $16) • D = ($96, .50; $12) • E = ($100, .50; $8)
LP Design • A = ($100, .50; $24) • B = ($100, .54; $20) • C = ($100, .58; $16) • D = ($100, .62; $12) • E = ($100, .66; $8)
PH Design • A = ($100, .50; $0) • B = ($96, .54; $0) • C = ($92, .58; $0) • D = ($88, .62; $0) • E = ($84, .66; $0)
Priority Heuristic Predictions • LH Design: E > D > C > B > A, but A > E • LP Design: A ~ B ~ C ~ D ~ E, but A > E • PH Design: A > B > C > D > E but E > A
Analysis • Each replication of each design has 20 choices; hence 1,048,576 possible data patterns (220) per rep. • There are 1024 possible consistent patterns (Rij = 2 iff Rji = 1, all i, j). • There are 120 (5!) possible transitive patterns.
Within-Rep Consistency • Count the number of consistent choices in a replicate of 20 choices (10 x 2). • If a person always chose the same button, consistency = 0. • If a person was perfectly consistent, consistency = 10. • Randomly choosing between 1 and 2 produces expected consistency of 5.
Within-Replicate Consistency • The average rate of agreement was 8.63 (86% self-agreement). • 46.4% of all replicates were scored 10; an additional 19.9% were scored 9.
Majority Data WST • LH Design A>B>C>D>E • LP Design A>B>C>D>E • PH Design E>D>C>B>A • Patterns consistent with special TAX with “prior” parameters. • But this analysis hides individual diffs
Individual Data • Choice proportions calculated for each individual in each design. • These were further broken down within each person by replication.
S# 6176 C = 9.8 Rep = 20; started with this pattern, then switched to perfectly consistent with the opposite pattern for 4 replicates at the end of the first day; back to this pattern for 10 reps on day 2.
S# 684 C = 8.1 Rep = 14; an intransitive pattern opposite that predicted by priority heuristic.
S# 7663 C = 6.3 Rep = 10; an intransitive pattern consistent with priority heuristic, DP = 0.05. Few reps and low self-consistency in this case.
Data Summary • For n = 51, there are 153 matrices. Of these, 90% were perfectly consistent with WST: P(A,B) ≥ 1/2 & P(B,C) ≥ 1/2 then P(A,C) ≥ 1/2. • 29 people had all three arrays fitting WST; no one had all three arrays with intransitive patterns.
Within-Person Changes in Preference Pattern • Criterion: Person must show perfect consistency (10 out of 10) to one pattern in one replication, and perfect consistency to another pattern on another replication. • 15 Such cases were found (10%). There may be other cases where the data are less consistent.
Summary • Recent studies fail to confirm systematic violations of transitivity predicted by priority heuristic. Adds to growing case against this descriptive model. • Individual data are mostly transitive. • Next Q: From individual data, can we predict, for example, from these data to other kinds of choices by same person, e. g., tests of SD?