Download
1 / 1
10 likes | 163 Vues

E N D
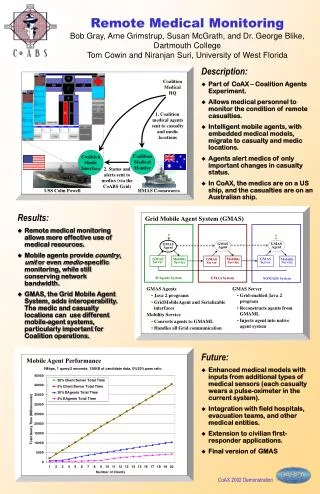
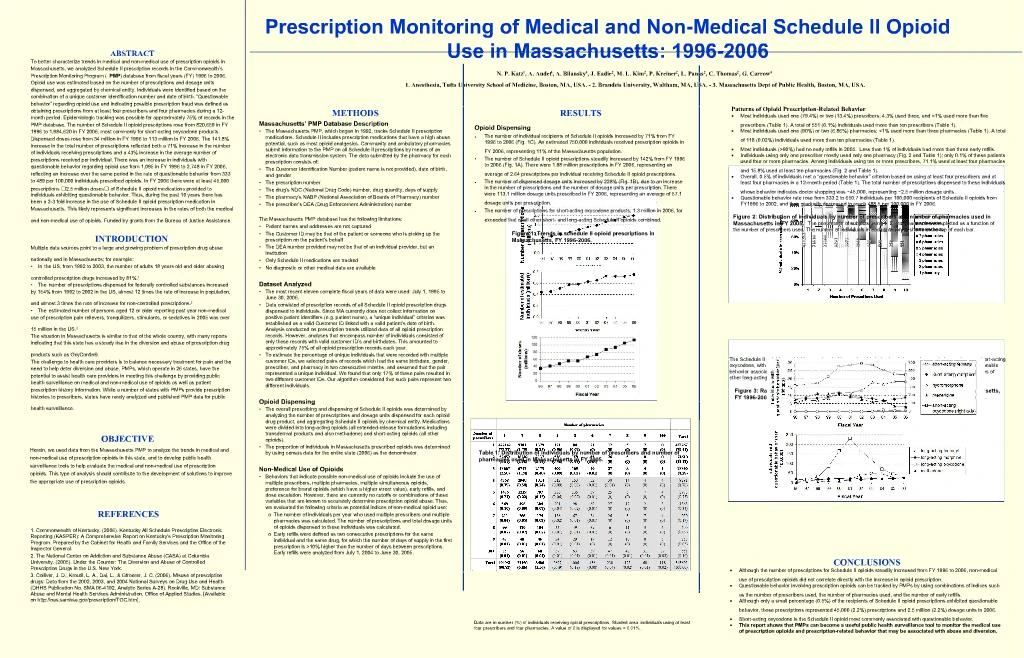
1. Prescription Monitoring of Medical and Non-Medical Schedule II Opioid Use in Massachusetts: 1996-2006 ABSTRACT
To better characterize trends in medical and non-medical use of prescription opioids in Massachusetts, we analyzed Schedule II prescription records in the Commonwealth�s Prescription Monitoring Program (PMP) database from fiscal years (FY) 1996 to 2006. Opioid use was estimated based on the number of prescriptions and dosage units dispensed, and aggregated by chemical entity. Individuals were identified based on the combination of a unique customer identification number and date of birth. �Questionable behavior� regarding opioid use and indicating possible prescription fraud was defined as obtaining prescriptions from at least four prescribers and four pharmacies during a 12-month period. Epidemiologic tracking was possible for approximately 75% of records in the PMP database. The number of Schedule II opioid prescriptions rose from 820,659 in FY 1996 to 1,984,620 in FY 2006, most commonly for short-acting oxycodone products. Dispensed doses rose from 34 million in FY 1996 to 113 million in FY 2006. The 141.8% increase in the total number of prescriptions reflected both a 71% increase in the number of individuals receiving prescriptions and a 43% increase in the average number of prescriptions received per individual. There was an increase in individuals with questionable behavior regarding opioid use from 1,095 in FY 1996 to 2,748 in FY 2006, reflecting an increase over the same period in the rate of questionable behavior from 333 to 489 per 100,000 individuals prescribed opioids. In FY 2006 there were at least 45,000 prescriptions ?2.5 million doses? of Schedule II opioid medications provided to individuals exhibiting questionable behavior. Thus, during the past 10 years there has been a 2-3 fold increase in the use of Schedule II opioid prescription medication in Massachusetts. This likely represents significant increases in the rates of both the medical and non-medical use of opioids. Funded by grants from the Bureau of Justice Assistance.