Download
1 / 20
200 likes | 339 Vues
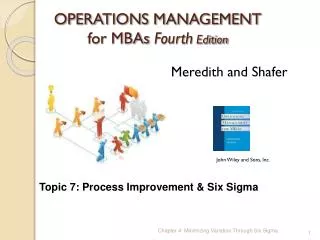
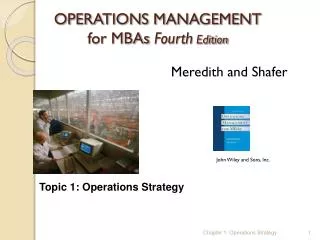
OPERATIONS MANAGEMENT for MBAs Fourth Edition. Meredith and Shafer. John Wiley and Sons, Inc. Topic 6: Controlling Processes. Monitoring and Controlling Processes. Balanced Scorecard Strategy Maps ISO 9000/14000/14001 Benchmarking Statistical Process Control

E N D
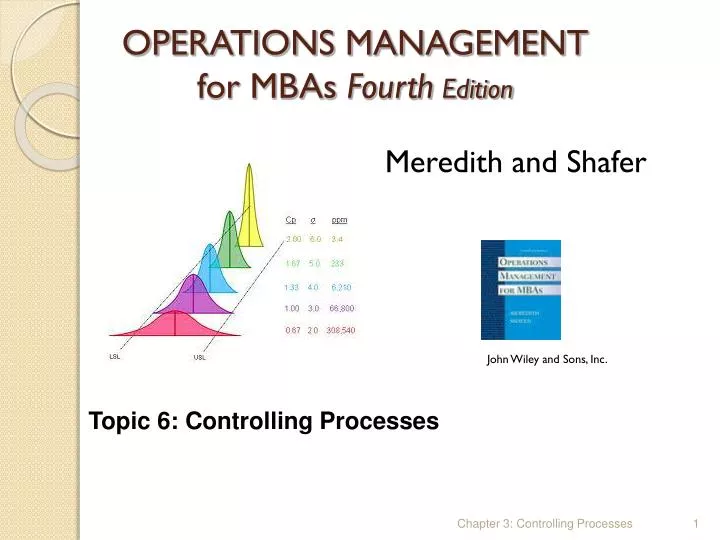
OPERATIONS MANAGEMENTfor MBAs Fourth Edition Meredith and Shafer John Wiley and Sons, Inc. Topic 6: Controlling Processes Chapter 3: Controlling Processes
Monitoring and Controlling Processes • Balanced Scorecard • Strategy Maps • ISO 9000/14000/14001 • Benchmarking • Statistical Process Control • Homework, Quality Control Charts – Next Section
Statistical Quality/Process Control The act of reducing differences between plan and reality for a process. Monitoring and comparing actual performance to a standard. Statistical Process Control (SPC/SQC) the application of statistical methods and procedures (such as control charts) to analyze the inherent variability of a process or its outputs to achieve and maintain a state of statistical control, and to improve the process capability.
SPC, Causes of Variation • Common causes • Random, unavoidable sources of variation • Assignable causes (out of statistical control) • Can be identified and eliminated • Change in the mean, spread, or shape
Control Chart Factors Example WS
Using xbar- and R-Charts EXAMPLE The management of West Allis Industries is concerned about the production of a special metal screw used by several of the company’s largest customers. The diameter of the screw is critical to the customers. Data from five samples appear in the accompanying table. The sample size is 4. Is the process in statistical control?
Process Capability IndexesCp and Cpk (for example) Process capability compares the output of an in-control process to the specification limits by using capability indices. The comparison is made by forming the ratio of the spread between the process specifications (the specification "width") to the spread of the process values, as measured by 6 process standard deviation units (the process "width"). Process capability refers to the ability of the process to meet the design specification for the product or service Design specifications are often expressed as a nominal value and a tolerance Three-sigma quality, Ratio>1 Four-sigma quality, Ratio>1.33 Six-sigma quality, Ratio>2
X X X X X X X X X X X X X X X X X X X X X X X X X X X X X X X X X X X Cp Bad Good Good Cpk Bad
Variation needs attention? Yes No Crit<Cpl=Cpu, Cp>Crit Crit<Cpl<Cpu, Cp>Crit Crit<Cpu<Cpl, Cp>Crit Crit<Cpl=Cpu, Cp<Crit Crit<Cpl<Cpu, Cp<Crit Crit<Cpu<Cpl, Cp<Crit No Centering needs attention? Crit>Cpl<Cpu, Cp<Crit Crit>Cpu<Cpl, Cp<Crit Crit>Cpl<Cpu, Cp>Crit Crit>Cpu<Cpl, Cp>Crit Yes