Download
1 / 23
230 likes | 429 Vues
Analysing Competition Among Shopping Alternatives Within the Quebec Metropolitan Area: How GIS can further modelling of consumer’s destination choice behaviour. Marius Thériault, Gjin Biba, François Des Rosiers & Paul Villeneuve

E N D
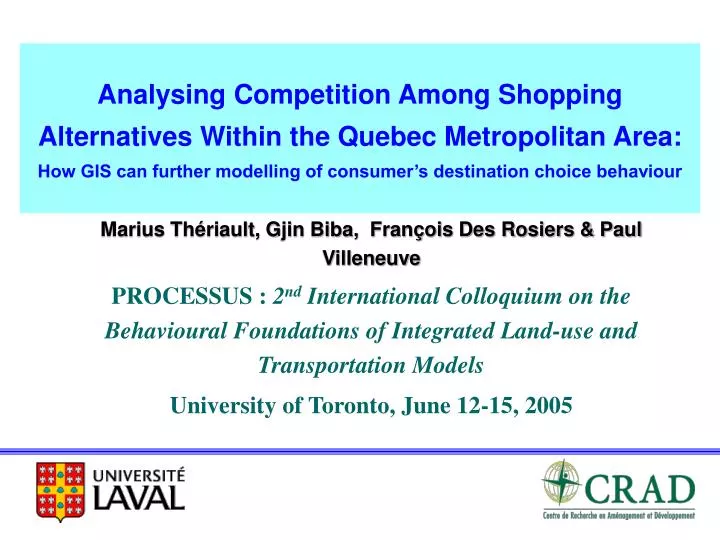
Analysing Competition Among Shopping Alternatives Within the Quebec Metropolitan Area:How GIS can further modelling of consumer’s destination choice behaviour Marius Thériault, Gjin Biba, François Des Rosiers & Paul Villeneuve PROCESSUS : 2nd International Colloquium on the Behavioural Foundations of Integrated Land-use and Transportation Models University of Toronto, June 12-15, 2005
Outline • Context of retail market transformations • Methodological approach and database • Main findings: • Market area and spatial competition among retail facilities • Store choice behaviour of consumers • Conclusion
Transformation of Retail Markets 2 Shopping Centers (after 1950) 3 Big Boxes (in expansion since 1990) 1 Commercial Streets • Changes of lifestyles: • increasing employment (feminization) • increasing motorization • Evolution of consumer’s preferences • Spatial and economic transformation • - Homogenizationofshopping centres • Urban sprawl (motorways) • Technical and organizational innovations in the retail sector (e.g. just in time) Evolution of retail structure (during the 20th Century) • Two main impacts: • Modifying consumer destination choice behaviour and retail industry competition • Changing urban dynamics (i.e. land use, activities location, transportation demand…)
Context of Quebec Metropolitan Area (QMA) • Agglomeration of 700 000 persons(7th in Canada and 2nd in Quebec) • 12 % of workforce (~ 50 000 persons) employed in retail sector; annual market of 8.2 billion of CAN$ • Economic and urban environment marked by: • Household purchasing power is 4 % above the provincial average • Strong urban sprawl • Highly developed motorway network (21 Kilometres / 100,000 inhabitants) • Retail structure (in 2001): • 87 shopping centers (including 2,300 stores, Total Floor Area > 11 M sq ft) • 44 big boxes (Total Floor Area > 3 M sq ft) • Roughly 5,000 individual stores (2,600 on 72 commercial street segments) • Evolution (1990-2001) of the retail structure: • Stagnation, even recession, of the number of shopping centers • Implementation of several isolated big boxes and power centres • Transformation of commercial streets (revitalization) Sources: Statistic Canada, Quebec City, CRAD
a) Evolution of distance and duration of shopping trips within QMA (1991 – 2001) b) Change of transportation modes used during shopping trips (%) Source: Origins-Destinations surveys, 1991, 1996, 2001 • MAIN CHANGES : • Better accessibility to the new stores (reduced travel time) • More prevalent car use for shopping trips • Decreasing use of public transportation for shopping and leisure activities Source: Origins-Destinations surveys, 1991, 1996, 2001 Accessibility to Shops - Consumer Behaviour
Research Purpose • Objectives : • Identify market areas and analyse spatial competition among commercial streets, shopping centers and big boxes • Investigate consumer behaviour when choosing retail store • Better understand social, economic and spatial impacts of new large retail outlets (big boxes and power centres) • Combining GIS and travel survey may contribute to analyse retail market dynamics and consumer choice behaviour Methodology: • Locating consumers and shopping trips (origin and destination) • Estimating markets share for each retail outlet • Delineating primary (50%) and secondary (80%) market areas • Modelling consumer store choice (discrete choice modelling)
Business Directory (2001) for the QMA Origin - Destination Survey (2001) Monday-Friday • 5,000 individual stores (50% located on commercial streets) • 54 neighborhood and 23 community shopping centers • 6 large shopping centers (3 regional and 3 super-regional) • 44 big boxes 174 243 trips 68 121 persons 27 839 households 25 522 shopping trips 17 943 persons 13 074 households Shopping Purposes (all trips) 21.8 % Grocery 11.9 % Restaurants 26.6 % Leisure 39.7 % Buy other products Geo-referenced using topographic maps (1: 20 000) Shortest Route Simulation Using TransCAD GIS (Travel time by Car) Database
Retail forms Neighbourhood shopping center (54) Community shopping center (23) Commercialstreet > 10 stores/Km (72) Big box > 50 000 sq Ft (44) Regional (3) and super-regional center (3) Retail Outlets Distribution
Distribution of Trips Among Destinations (O-D, 2001) (Monday to Friday)
Primary Market Area (Convex Hull - 50% of closest customers using travel time) Secondary Market Area (80% of customers) Shopping trips origines The polygon of a Commercial Street (Shopping destination is “Avenue Cartier”) Delineation of Market Areas
Primary and Secondary Market Areas (2001) Commercial Streets with Neighbourhood Shopping Center 24 segments; 1,645 individual shops Primary Market Area = 5.6 sq. Km Average Control of Market = 12.3 % Secondary Market Area = 30 sq. Km Average Control of Market = 6.8 %
Commercial Streets Without Shopping Center 42 Segments; 1,062 individual shops Primary Market Area = 4.8 sq. Km Average Control of Market = 9.4 % Secondary Market Area = 20.5 sq. Km Average Control of Market = 8.3 %
Community Shopping Centres 23 centres; 686 individual shops Primary Market Area = 7.7 sq. Km Average Control of Market = 11.9 % Secondary Market Area = 54.1 sq. Km Average Control of Market = 9.5 %
Regional and Super-regional Shopping Centres 6 centres; 1,124 individual shops Primary Market Area = 47.8 sq. Km Average Control of Market = 14.2 % Secondary Market Area = 297.1 sq. Km Average Control of Market = 9.9 %
Big Boxes – Grocery & Beverage 11 stores; Total Floor Area=76 710 sq. m Primary Market Area = 19.3 sq. Km Average Control of Market = 3.8 % Secondary Market Area = 82.6 sq. Km Average Control of Market = 1.6 %
Big Boxes - Renovation Products 6 stores; Total Floor Area = 48 946 sq. m. Primary Market Area = 66.4 sq. Km Average Control of Market = 1.3 % Secondary Market Area = 117.6 sq. Km Average Control of Market = 0.9 %
Big Boxes - Car related products (Canadian Tire) 5 stores; Total Floor Area = 38 785 sq. m. Primary Market area = 11.0 sq. Km Average Control of Market = 2.0 % Secondary Market Area = 39.6 sq. Km Average Control of Market = 1.0 %
Big Boxes - Mixed Products (Wal–Mart) 3 stores; Total Floor Area 31 850 sq. m Primary Market Area = 33.8 sq. Km Average Control of Market = 6.6 % Secondary Market Area = 56.5 sq. Km Average Control of Market = 5.7 %
Others Big boxes 5 stores; Total Floor Area= 21 074 sq. m. Primary Market Area = 10.3 sq. Km Average Control of Market = 2.9 % Secondary Market Area = 48.0 sq. Km Average Control of Market = 0.8 %
Where, When, and How go shopping ? Consumer store choice = f (utility) = f (retail structure, consumer profile, spatial determinants) • Set of shopping choice alternatives: • Commercial streets (with/without neighbourhood shopping center) • Community shopping centres • Regional and super regional shopping centres • Big boxes and power centers • Spatial determinants: • - Consumer origin and destination place • Transportation mode and trip attributes • Consumer profile: • Socio-economic and professional status • - Household characteristics Accessibility Satisfaction Modelling Consumer’s Destination Choice «We investigate consumer destination choice (type of outlet) rather than consumer behaviour within commercial space» Multinomial Logistic Regression Model Adjusted using O-D Survey Data
Type of Shop Choice: MNL Parameters Reference is “Big Boxes - Power Centres” [Figures present odds ratios] Significant levels: -- non significant;* 0.1; ** 0.5; *** 0.01
Conclusion Methodology: • Combining GIS and Statistical Analysis was efficient for modeling both spatial and non-spatial determinant of retail trade market Competition among retail facilities and consumer behaviour: • Commercial streets (week days, resist fairly well to competition): • Multi-purpose trips especially Leisure and Restaurant, Lone persons • Integration of small shopping centres yields a comparative advantage • Community shopping centres (threatened by big boxes development): • Grocery, Single - parent families, Retired • Their endurance is mostly related to strategic location • Regional & super-regional shopping centres(yet very competitive): • Proximity to workplaces and bus routes; Large choice of products, Women • One of their last competition strategy may be to agglomerate with power centres • Big Boxes(extending their geographic and economic market shares): • Car trips, Men, Workers, Households with children • The most competitive are in grocery, mixed products and renovation sectors Retail evolution, impacts on transportation and urban dynamics: • Big boxes are threatening for shopping centres (mostly at neighbourhood and regional levels) • Increases car use and demand for new transportation infrastructures • Strong competition means potential readjustment of commercial real estate values, activities redistribution (or relocation), traffic, road infrastructures…