Download
1 / 1
10 likes | 85 Vues
CATG. CATG. CATG. CATG. CATG. CATG. CATG. SAGE

E N D
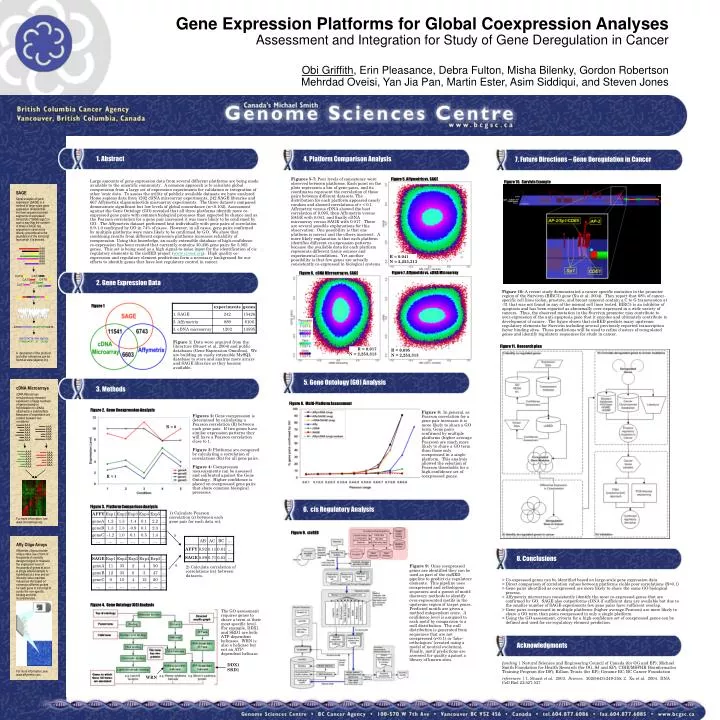
CATG CATG CATG CATG CATG CATG CATG SAGE Serial analysis of gene expression (SAGE) is a method of large-scale gene expression analysis.that involves sequencing small segments of expressed transcripts ("SAGE tags") in such a way that the number of times a SAGE tag sequence is observed is directly proportional to the abundance of the transcript from which it is derived. A description of the protocol and other references can be found at www.sagenet.org. AAA AAA AAA AAA AAA AAA AAA AAA AAA AAA AAA AAA AAA …CATGGATCGTATTAATATTCTTAACATG… GATCGTATTA 1843 Eig71Ed TTAAGAATAT 33 CG7224 cDNA Microarrays cDNA Microarrays simultaneously measure expression of large numbers of genes based on hybridization to cDNAs attached to a solid surface. Measures of expression are relative between two conditions. For more information, see www.microarrays.org. AAA AAA AAA AAA AAA AAA AAA AAA AAA AAA AAA AAA AAA AAA AAA AAA AAA AAA AAA AAA Affy Oligo Arrays Affymetrix oligonucleotide arrays make use of tens of thousands of carefully designed oligos to measure the expression level of thousands of genes at once. A single labeled sample is hybridized at a time and an intensity value reported. Values are the based on numerous different probes for each gene or transcript to control for non-specific binding and chip inconsistencies. Gene Expression Platforms for Global Coexpression Analyses Assessment and Integration for Study of Gene Deregulation in Cancer Obi Griffith, Erin Pleasance, Debra Fulton, Misha Bilenky, Gordon Robertson Mehrdad Oveisi, Yan Jia Pan, Martin Ester, Asim Siddiqui, and Steven Jones 1. Abstract 4. Platform Comparison Analysis 7. Future Directions – Gene Deregulation in Cancer Figure 5. Affymetrix vs. SAGE Figures 5-7: Poor levels of consistency were observed between platforms. Each point on the plots represents a bin of gene pairs, and its coordinates represent the correlation of those pairs between different datasets. The distribution for each platform appeared nearly random and showed correlations of r < 0.1. Affymetrix versus cDNA showed the best correlation of 0.095, then Affymetrix versus SAGE with 0.041, and finally cDNA microarray versus SAGE with 0.017. There are several possible explanations for this observation: One possibility is that one platform is correct and the others incorrect. A more likely explanation is that each platform identifies different co-expression patterns because the available data for each platform represents different tissue sources and experimental conditions. Yet another possibility is that few genes are actually consistently co-expressed in biological systems. Large amounts of gene expression data from several different platforms are being made available to the scientific community. A common approach is to calculate global coexpression from a large set of expression experiments for validation or integration of other ‘omic data. To assess the utility of publicly available datasets we have analyzed Homo sapiens data from 1202 cDNA microarray experiments, 242 SAGE libraries and 667 Affymetrix oligonucleotide microarray experiments. The three datasets compared demonstrate significant but low levels of global concordance (rc<0.102). Assessment against the Gene Ontology (GO) revealed that all three platforms identify more co-expressed gene pairs with common biological processes than expected by chance and as the Pearson correlation for a gene pair increased it was more likely to be confirmed by GO. The Affymetrix dataset performed best individually with gene pairs of correlation 0.9-1.0 confirmed by GO in 74% of cases. However, in all cases, gene pairs confirmed by multiple platforms were more likely to be confirmed by GO. We show that combining results from different expression platforms increases reliability of coexpression. Using this knowledge, an easily extensible database of high-confidence co-expression has been created that currently contains 30,456 gene pairs for 5,562 genes. This set is being used as a high signal-to-noise input for the identification of cis regulatory elements in the cisRED project (www.cisred.org). High quality co-expression and regulatory element predictions form a necessary background for our efforts to identify genes that have lost regulatory control in cancer. Figure 10. Survivin Example R = 0.041 N = 2,253,313 Figure 7. Affymetrix vs. cDNA Microarray Figure 6. cDNA Microarray vs. SAGE 2. Gene Expression Data Figure 10: A recent study demonstrated a cancer specific mutation in the promoter region of the Survivin (BIRC5) gene (Xu et al. 2004). They report that 68% of cancer-specific cell lines (colon, prostate, and breast cancers) contain a C to G transversion at -31 that was not found in any of the normal cell lines tested. BIRC5 is an inhibitor of apoptosis and has been reported as abnormally over-expressed in a wide variety of cancers. Thus, the observed mutation in the Survivin promoter may contribute to over-expression of the anti-apoptosis gene that it encodes and ultimately contribute to development of cancer. The figure shows that cisRED predicts many upstream regulatory elements for Survivin including several previously reported transcription factor binding sites. These predictions will be used to refine clusters of coregulated genes and identify regulatory sequences for study in cancer. Figure 1 Figure 1: Data were acquired from the literature (Stuart et al, 2004) and public databases (Gene Expression Omnibus). We are building an easily extensible MySQL database to store and analyze more arrays and SAGE libraries as they become available. Figure 11. Research plan R = 0.017 N = 2,253,313 R = 0.095 N = 2,253,313 5. Gene Ontology (GO) Analysis 3. Methods Figure 8. Multi-Platform Assessment Figure 2. Gene Coexpression Analysis Figure 8: In general, as Pearson correlation for a gene pair increases it is more likely to share a GO term. Gene pairs confirmed by multiple platforms (higher average Pearson) are much more likely to share a GO term than those only coexpressed in a single platform. This analysis allowed the selection of Pearson thresholds for a high-confidence set of coexpressed genes. Figures 2: Gene coexpression is determined by calculating a Pearson correlation (R) between each gene pair. If two genes have similar expression patterns they will have a Pearson correlation close to 1. Figure 3: Platforms are compared by calculating a correlation of correlations (Rc) for all gene pairs. Figure 4: Coexpression measurements can be assessed and calibrated against the Gene Ontology. Higher confidence is placed on coexpressed gene pairs that share common biological processes. R ≈ 0 R ≈ 1 6. cis Regulatory Analysis Figure 3. Platform Comparison Analysis 1) Calculate Pearson correlation (r) between each gene pair for each data set. Figure 9. cisRED r 8. Conclusions r Figure 9: Once coexpressed genes are identified they can be used as part of the cisRED pipeline to predict cis regulatory elements. This pipeline uses coexpressed and orthologous sequences and a gamut of motif-discovery methods to identify over-represented motifs in the upstream region of target genes. Predicted motifs are given a method independent score. A confidence level is assigned to each motif by comparison to a null distribution. The null distribution is generated from sequences that are not coexpressed (r<0.1) or ‘fake-orthologues’ (created using a model of neutral evolution). Finally, motif predictions are assessed for quality against a library of known sites. 2) Calculate correlation of correlations (rc) between datasets. > Co-expressed genes can be identified based on large-scale gene expression data > Direct comparison of correlation values between platforms yields poor correlations (R<0.1) > Gene pairs identified as coexpressed are more likely to share the same GO biological process. > Affymetrix microarrays consistently identify the most co-expressed genes that are confirmed by GO. SAGE also outperforms cDNA if sufficient data are available but due to the smaller number of SAGE experiments few gene pairs have sufficient overlap. > Gene pairs coexpressed in multiple platforms (higher average Pearson) are more likely to share a GO term than pairs coexpressed in only a single platform. > Using the GO assessment, criteria for a high-confidence set of coexpressed genes can be defined and used for cis-regulatory element prediction. Figure 4. Gene Ontology (GO) Analysis The GO assessment requires genes to share a term at their most specific level. For example, DDX1 and SRD1 are both ATP-dependent helicases. WRN is also a helicase but not an ATP-dependent helicase. Acknowledgments funding | Natural Sciences and Engineering Council of Canada (for OG and EP); Michael Smith Foundation for Health Research (for OG, SJ and EP); CIHR/MSFHR Bioinformatics Training Program (for DF); Killam Trusts (for EP); Genome BC; BC Cancer Foundation references | 1. Stuart et al. 2003. Science. 302(5643):249-255; 2. Xu et al. 2004. DNA Cell Biol 23:527-537 DDX1 SRD1 For more information, see www.affymetrix.com. WRN