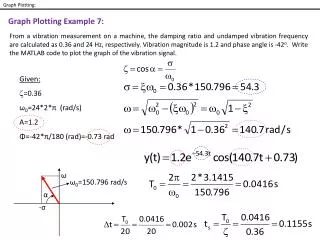
Download

1 / 26
260 likes | 380 Vues
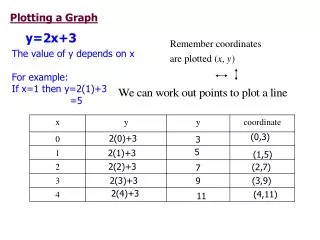
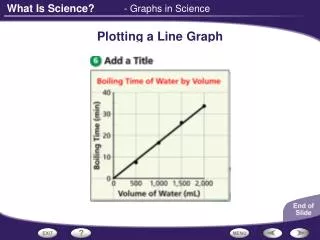
Plotting a Straight Line Graph. From Supplied Data. NEXT. We will work through the following. Draw the graph of the following data. x -3 -2 -1 0 1 2 3 4 y -11 -9 -7 -5 -3 -1 1 3. NEXT. These are the two lines at right angles to each other which give us our scale.

E N D
Plotting a Straight Line Graph From Supplied Data NEXT
We will work through the following Draw the graph of the following data. x -3-2-1 0 1234 y -11-9-7-5-3-113 NEXT
These are the two lines at right angles to each other which give us our scale. First the x-axis and it’s scale. Remember it goes from –3 to +4 Draw the Axes x
The x-axis is drawn and the markings put on Draw the Axes • These are the two lines at right angles to each other which give us our scale. • First the x-axis and it’s scale. Remember it goes from –3 to +4 x
The numbers are then put on Draw the Axes • These are the two lines at right angles to each other which give us our scale. • First the x-axis and it’s scale. Remember it goes from –3 to +4 x -3 -2 -1 0 1 2 3 4 NEXT
Draw the Axes • Now draw the y-axis and its scale. Remember that it goes from –11 to +3 x -3 -2 -1 0 1 2 3 4
The y-axis is now put on Draw the Axes • Now draw the y-axis and its scale. Remember that it goes from –11 to +3 y x -3 -2 -1 0 1 2 3 4
And the markings put on Draw the Axes • Now draw the y-axis and its scale. Remember that it goes from –11 to +3 y x -3 -2 -1 0 1 2 3 4
Then the numbers Draw the Axes • Now draw the y-axis and its scale. Remember that it goes from –11 to +3 y 4 2 x -3 -2 -1 0 1 2 3 4 -2 -4 -6 -8 -10 -12 -14 NEXT
Now that we have drawn the axes, we can start to think about the plotting of the points. • We have to consider the coordinates in pairs. • The first pairs of coordinates are (-3, -11) • This means we measure 3 units along the x-axis to the left of the 0, since the value has a minus sign, (-3) • And we measure 11 units down the y-axis, again since the value has a minus sign. NEXT
Remembering that everything to the RIGHT and UPWARDS is positive And everything the the LEFT and DOWNWARDS is negative
Insert the axis and the signs of the coordinates • Remembering that everything to the • RIGHT and UPWARDS is positive • And everything the the LEFT and • DOWNWARDS is negative + Measurements in these DIRECTIONS are POSITIVE (+, +) (–, +) + - Measurements in these DIRECTIONS are NEGATIVE - (+, –) (–, –) NEXT
Put in the points on the graph (-3, -11) x -3 -2 -1 0 1 2 3 4 y -11 -9 -7 -5 -3 -1 1 3 To plot the point (-3, -11) (-3, -11) NEXT
Put in the points on the graph (-2, -9) x -3 -2 -1 0 1 2 3 4 y -11 -9 -7 -5 -3 -1 1 3 To plot the point (-2, -9) (-2, -9)
Put in the points on the graph (-1, -7) x -3 -2 -1 0 1 2 3 4 y -11 -9 -7 -5 -3 -1 1 3 To plot the point (-1, -7) (-1, -7)
Put in the points on the graph (0, -5) x -3 -2 -1 0 1 2 3 4 y -11 -9 -7 -5 -3 -1 1 3 To plot the point (0, -5) (0, -5)
Put in the points on the graph (1, -3) x -3 -2 -1 0 1 2 3 4 y -11 -9 -7 -5 -3 -1 1 3 To plot the point (1, -3) (1, -3)
Put in the points on the graph (2, -1) x -3 -2 -1 0 1 2 3 4 y -11 -9 -7 -5 -3 -1 1 3 To plot the point (2, -1) (2, -1)
Put in the points on the graph (3, 1) x -3 -2 -1 0 1 2 3 4 y -11 -9 -7 -5 -3 -1 1 3 To plot the point (3, 1) (3, 1)
Put in the points on the graph (4, 3) x -3 -2 -1 0 1 2 3 4 y -11 -9 -7 -5 -3 -1 1 3 To plot the point (4, 3) (4, 3)
Put in the points on the graph (4, 3) x -3 -2 -1 0 1 2 3 4 y -11 -9 -7 -5 -3 -1 1 3 To plot the point (4, 3)
All the points have been plotted All the points have now been plotted NEXT
Once all the points have been plotted, you should draw the BEST STRAIGHT LINE, which best shows the data so that further work can be done on it. NEXT