Download
1 / 72
810 likes | 1.2k Vues
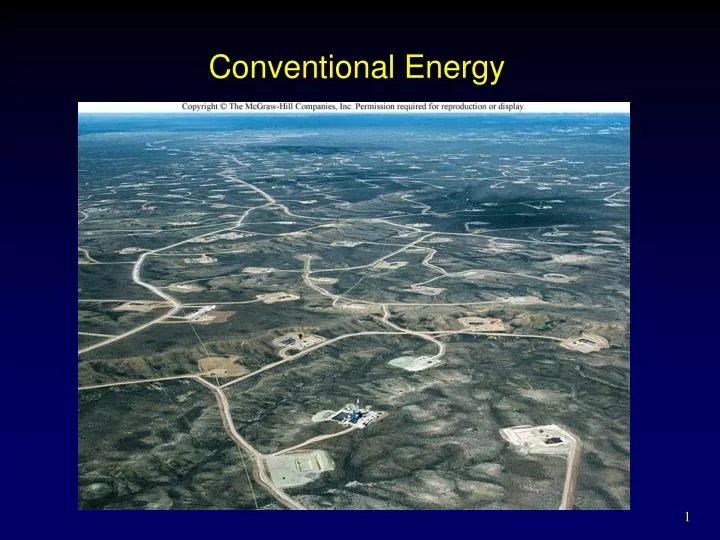
Conventional Energy. Outline. Energy History How Energy Is Used Coal Oil Natural Gas Nuclear Power Fission Reactors Waste Management Fusion. Energy Resource Transition. During the 20th century, worldwide use of energy resources shifted dramatically: COAL: 55% to 22%

E N D
Outline • Energy History • How Energy Is Used • Coal • Oil • Natural Gas • Nuclear Power • Fission • Reactors • Waste Management • Fusion
Energy Resource Transition • During the 20th century, worldwide use of energy resources shifted dramatically: • COAL: 55% to 22% • OIL: 2% to 30% • NATURAL GAS 1% to 23% • NUCLEAR 0% to 6% • RENEWABLE 42% to 19%
WHAT IS ENERGY • Work - Application of force through a distance. • Energy - The capacity to do work. • Power - Rate at which work is done. • Calorie - Amount of energy necessary to heat 1 gram of water 1o C. • Joule - Amount of work done when a force of 1 newton is exerted over 1 meter.
Energy History • Fire probably first human energy technology. • Muscle power provided by domestic animals has been important since dawn of agriculture 10,000 years ago. • Wind and water power used nearly as long. • Coal replaced wood at beginning of 19th century. • Oil replaced coal in 20th century.
Current Energy Sources • Fossil fuels currently provide about 86% of all commercial energy in the world. • Hydroelectric dams supply about 7% of commercial power. • Nuclear power makes up about 7% of commercial power.
Per Capita Consumption • Richest countries have consumed nearly 80% of all commercial energy. This is changing. • On average, each person in the U.S. and Canada uses more than 300 GJ of energy annually. • In poorest countries of the world, each person generally consumes less than one GJ annually.
HOW ENERGY IS USED • Largest share of energy used in the U.S. is consumed by industry (33%). • Residential and Commercial buildings use 20% of primary energy consumed in U.S.. • Transportation consumes about 27% of all energy used in the U.S.. • Three trillion passenger miles and 600 billion ton miles of freight carried annually by motor vehicles in the U.S..
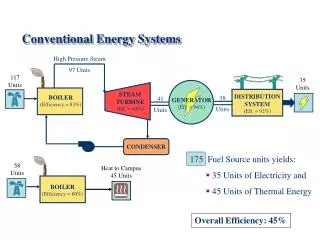
How Energy Is Used • About half of all energy in primary fuels is lost during conversion to more useful forms while being shipped, or during use. • Nearly two-thirds of energy in coal being burned to generate electricity is lost during thermal conversion in the power plant. • Another 10% is lost during transmission and stepping down to household voltages.
COAL • Fossilized plant material preserved by burial in sediments and compacted and condensed by geological forces into carbon-rich fuel. • Most laid down during Carboniferous period (286 million to 360 million years ago).
Coal • -Coal replaced wood in the 18th century in the western world and supplied the energy for the steam engine and the Industrial Revolution. • 23.5% of the world’s energy is provided by coal worldwide; this number is steadily increasing due to China’s • -Coal power plants provide over half of the nations’ electricity. • -The US used over 1 billion tons of coal in 2005
Reserves • Proven reserves- have been identified, mapped, measured, and shown to be economically recoverable. • Known reserves -have been identified but not thoroughly mapped. • World total resource is estimated to be 10 trillion metric tons. (several thousand years’ supply) • Known US reserves are 266 billion tons.
Coal • Resources and Reserves • World coal deposits are ten times greater than conventional oil and gas resources combined. • Under current consumption rates, this could last several thousand years.
Environmental Issues • Coal contains 10% sulfur (by weight) • Toxic metals- uranium, arsenic, lead, cadmium, mercury, rubidium, thallium, and zinc. • These were absorbed by plants and concentrated in the process of coal formation, released when burned. • 25% of all atmospheric mercury • Oxidizes nitrogen compounds • Releases carbon dioxide-1/2 of industrial carbon dioxide • Underground mines-poisonous or explosive gases. (Black lung disease)
Coal • Mining • Between 1870 and 1950, more than 30,000 coal miners died of accidents and injuries in Pennsylvania alone. • Several thousands have died of respiratory diseases. • Black Lung Disease - Inflammation and fibrosis caused by accumulation of coal dust in the lungs or airways.
Coal • Air Pollution • Coal burning releases radioactivity and toxic metals into the atmosphere. • Coal combustion is responsible for 25% of all atmospheric mercury pollution in the U.S.. • Coal contains up to 10% sulfur by weight. • Unless removed by washing or flue-gas scrubbing, sulfur is released and oxidizes to sulfur dioxide or sulfate.
-The 3 major coal producing states are Wyoming, West Virginia, and Kentucky • -There are three types of coal: • 1. Lignite -youngest coal, lowest carbon content, brown coal, mainly used for electric power generation. • 2. Bituminous - the most plentiful form of coal in the US. Higher carbon content than lignite and will burn much hotter. Primarily used to generate electricity and make coke for the steel industry.
3. Anthracite -highest carbon content and hottest when burned. There are 7.3 billion tons of anthracite reserves in the US. • -Other products made from coal are: • 1. Perfumes • 2. Fingernail polish • 3. Briquettes • 4. Insecticides • 5. Disinfectants • 6. Antiseptics • 7. Dyes
8. Detergents • 9. Herbicides • 10. Varnish • 11. Plastic • 12. Paving • 13. Roofing • 14. Fertilizers • 15. Ammonia • 16. TNT • 17. Explosives • 18. Pharmaceuticals • 19. Smelling salts
The Earth at Night-main use for coal is production of electricity.
Petroleum-oil • Fossil fuel –composed of prehistoric marine plants & animals • Oil was first discovered in the US in 1859. • At the beginning of the 20th century, oil supplied only 4% of the world’s energy.
Today oil supplies about 40% of the world’s energy. • The US imports over 60% of the oil we use. • 95% of the energy for transportation in the US comes from oil. • Each day US consumers use about 850 million gallons of oil. • 40% of the petroleum is produced domestically by 500,000 oil wells
There are 132 refineries in the US that turn the oil into useful products. • 45% of crude oil is refined into gasoline for use in cars -370 millions gallons/day. • It takes over 42,000 daily trips to transport fuel to over 170,000 service stations across the US (one delivery every 2 seconds )
Ink, Dishwashing liquids ,Paint brushes, Telephones ,Toys, Unbreakable dishes, Insecticides ,Antiseptics, Dolls, • Car sound insulation ,Fishing lures, Deodorant ,Tires ,Motorcycle helmets, Linoleum, Sweaters ,Tents, Refrigerator linings, Paint rollers, Floor wax, Shoes ,Electrician's tape, • Plastic wood ,Model cars glue, Roller-skate wheels ,Trash bags ,Soap dishes ,Skis ,Permanent press clothes, Hand lotion, Clothesline,
Vitamin capsules, Movie film ,Ice chests, Candles, Rubbing alcohol, Loudspeakers,Ice buckets, Boats, Ice cube trays, • Credit cards, Fertilizers, Crayons, Insect repellent, Water pipes, Toilet seats, Caulking, Roofing shingles, Fishing boots, Life jackets, Balloons • Shower curtains, Garden hose, Golf balls, Curtains, Plywood, adhesive, Umbrellas, Detergents, • Milk jugs, Beach umbrellas, Rubber cement, Sun glasses, Putty Faucet washers, Cold cream, Bandages, Tool racks,
Dyes ,Soft contact lenses ,Shampoo, Panty hose ,Cameras ,Food preservatives , • Fishing rods ,Oil filters ,Combs, Transparent tape ,Anesthetics ,Upholstery ,Dice ,Disposable diapers ,TV cabinets • Cassettes ,Mops, Sports car bodies, Salad bowls, House paint ,Purses, Electric blankets, Awnings ,Ammonia, Dresses , Car battery cases, Safety glass ,Hair curlers ,Pajamas ,Synthetic rubber, VCR tapes ,Eyeglasses ,Pillows
Antihistamines ,Hair coloring, Nail polish, Slacks, Drinking cups, Guitar strings, False teeth ,Yarn ,Petroleum jelly, Toothpaste, • Golf bags, Roofing ,Tennis rackets, Toothbrushes, Perfume, Luggage, Wire insulation ,Folding doors ,Shoe polish, Fan belts, Ballpoint pens , • Shower doors, • Cortisone, Carpeting, Artificial turf ,Heart valves, LP records, Lipstick, Artificial limbs ,Hearing aids, Vaporizers ,Aspirin ,Shaving cream, Wading pools, Parachutes
The top sources of US crude oil imports for December were: (as of 12/06) 1. Canada (1.829 million barrels/day) 2. Saudi Arabia (1.471 million barrels/ day) 3. Mexico (1.245 million barrels/ day) 4. Venezuela (1.045 million barrels/ day), 5.Nigeria (1.010 million barrels per day). 6.Angola (0.610 million barrels/ day) 7. Algeria (0.421 million barrels/ day) 8. Iraq (0.419 million barrels/ day) 9. Ecuador (0.254 million barrel/day) 10. Kuwait (0.163 million barrels/day).
Biggest oil producers http://www.cnbc.com/id/41887743/The_World_s_15_Biggest_Oil_Producers
Price of a gallon of gasoline Crude oil: 67 percent • Refining: 11 percent • Taxes: 13 percent • Distribution and marketing: 9 percent
Production costs 65¢ • Producer profit 1.15 • Refining costs 50¢ • Refining profit 20¢ • Transportation costs 12¢ • Transportation profit 9¢ • Marketing costs 4¢ • Marketing profit 4¢ • Retailer costs 8¢ • Retailer profit 8¢ • US Taxes 29¢ • State taxes (avg. 23¢)6¢ to 39¢ • Local taxes 0 to 20¢ • TOTAL $3.24
OIL • Resources and Reserves • Total amount of oil in the world is estimated at 4 trillion barrels. (Half is thought to be ultimately recoverable) • In 2005, proven reserves were estimated at 1 trillion barrels. • As oil becomes depleted and prices rise, it will likely become more economical to find and bring other deposits to market.
NATURAL GAS • World’s third largest commercial fuel. • 23% of global energy consumption. • Produces half as much CO2 as equivalent amount of coal. • Most rapidly growing energy source. • Difficult to ship long distances, and to store in large quantities.
Natural Gas • Resources and Reserves • Proven world reserves of natural gas are 5,500 trillion ft3. • Current reserves represent roughly 60 year supply at present usage rates. • Proven reserves in North America are about 250 trillion ft3.
Unconventional Gas Sources • Methane hydrate - Small individual molecules of natural gas trapped in a crystalline matrix of frozen water. • Thought to hold 10,000 gigatons of carbon, or twice as much as combined amount of all traditional fossil fuels combined. • Difficult to extract, store, and ship.
NUCLEAR POWER • President Dwight Eisenhower, 1953, “Atoms for Peace”speech. • Nuclear-powered electrical generators would provide power “too cheap to meter.” • Between 1970 and 1974, American utilities ordered 140 new reactors for power plants.
Nuclear Power • After 1975, only 13 orders were placed for new nuclear reactors, and all of those were subsequently cancelled. • In all, 100 of 140 reactors on order in 1975 were cancelled. • Electricity from nuclear power plants was about half the price of coal in 1970, but twice as much in 1990.