Download
1 / 16
170 likes | 282 Vues
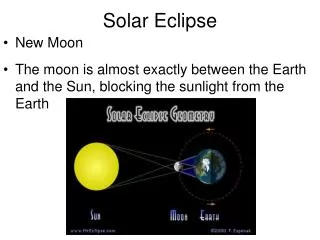
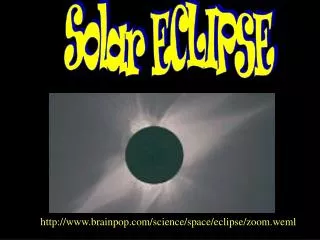
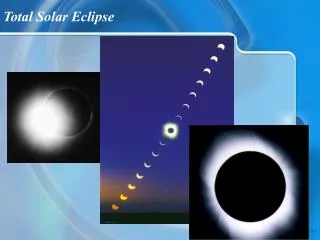
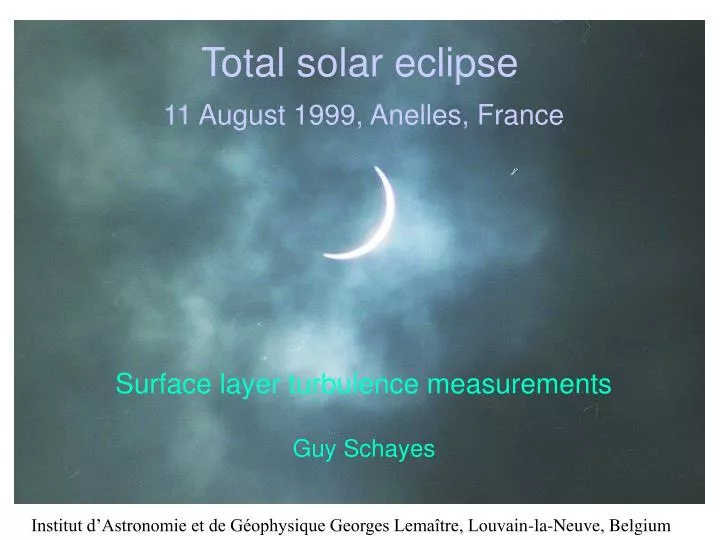
Surface layer turbulence measurements Guy Schayes. Institut d’Astronomie et de Géophysique Georges Lemaître, Louvain-la-Neuve, Belgium. Total solar eclipse. 11 August 1999, Anelles, France. center line. Anelles. Location of experiment. Totality Zone 130 km wide. Pictures of event.

E N D
Surface layer turbulence measurements Guy Schayes Institut d’Astronomie et de Géophysique Georges Lemaître, Louvain-la-Neuve, Belgium Total solar eclipse 11 August 1999, Anelles, France
center line Anelles Location of experiment Totality Zone 130 km wide
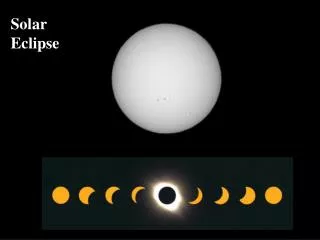
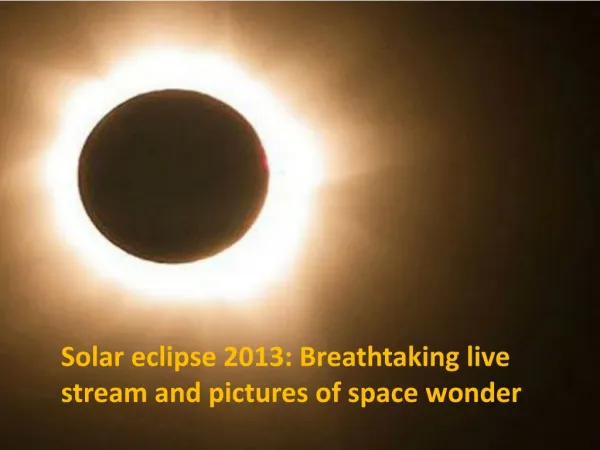
Pictures of event Gill propeller 3D anemometer
Photosphere: depth 350 km i.e. 1/2000 of Ro T = 5780 K, coldest zone of solar atmosphere
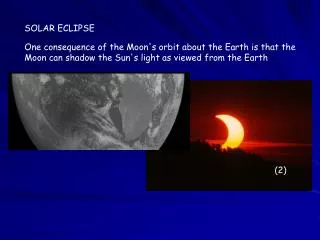
Interest of atmospheric measurements during an eclipse • Effect on radiation balance at first look similar to a passing big Cu • This effect is much larger : the totality shadow is more than 100 km wide; the duration of the partial occultation is of the order of two hours • → we are in presence of a mesoscale atmospheric feature with a predominant 1D structure • As for the diurnal cycle, the SL is still in equilibrium with the phenomenon; the hole BL is not • Possibility of finding an upper boundary for the time constant of the of atmospheric turbulence decay
Diurnal variation of the radiation balance 1000 W/m2 (summer) Eclipse effect global solar radiation (R) Net radiation Balance (Bn) 0 12 24 h infra-red (Qt-Qa)
Rg Radiation data Rn Totality duration : 2 min 01s Tg
u Raw turbulent data v t = 1 s 17 000 points w T
Statistical results Slices of 15 min each (900 data pts)
Conditions at eclipse begin (6): H0 = 40 W m-2 hi = 400 m (est.) w* = 0.77 m s-1 u* = 0.5 m s-1 t* = 520 s Longueur de M-O :
Decay phase TKE Ratios : u w T B T u v u* w
Decay characteristics • Previous LES studies : • Nieuwstadt F., Brost R. (1986). The decay of convective turbulence • J. Atm. Sc. 43, 532-546 • Sorbjan R. (1997). Decay of convective turbulence revisited. • BLM, 82, 501-515. • This experiment agrees on : • Rapid and immediate decay of var T • var u stays constant for about 2 t*then decays slowly • var w decays more rapidly than var u • TKEdecays with a -2 power law • Decay time (e-1) : less than 15 min for T, and 30 min for TKE.
TKE decay Comparison of data points with turbulence model Goulard et al. (2003), BLM 107, 143-155 Anfossi D., Schayes G. et Goulard, BLM, 2004
Wavelet Transform of T Zoom on central part
Conclusions • The measurements succeeded in measuring the variations in the characteristics of the SL turbulence • One of the (very) few measurements of this kind • Model study to be improved … • Sky conditions were not optimal but : • Next occurrences : • Spain, on 3 October 2005 (annular) • Libya, Turkey, on 29 March 2006 • Siberia, on 1 August 2008 • …