Download
1 / 19
190 likes | 319 Vues
Socio-ecological vulnerability assessment for Germany. A sub-national approach Marion Damm. Table of content. Problem Definition Objectives Conceptual Framework Methodology Preliminary Results Conclusion and Outlook. Floods in Germany. DLR. Flood Extent. Year. River. Damage [m].

E N D
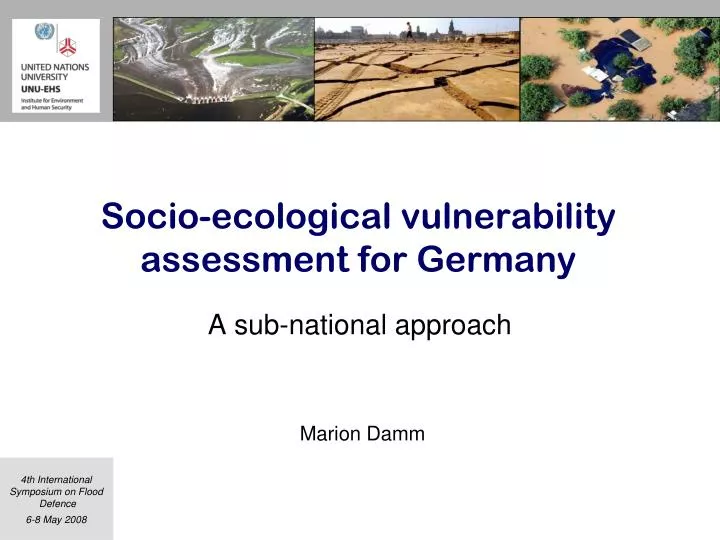
Socio-ecological vulnerability assessment for Germany A sub-national approach Marion Damm
Table of content Problem Definition Objectives Conceptual Framework Methodology Preliminary Results Conclusion and Outlook
Floods in Germany DLR Flood Extent Year River Damage [m] UNU-EHS 2002 Elbe 9200 € 2005 Danube 900 € 1999 Danube, Rhine 530 € Vulnerability 1995/1993 Rhine 810 € GFZ Damage Model Elbe Rhine Danube
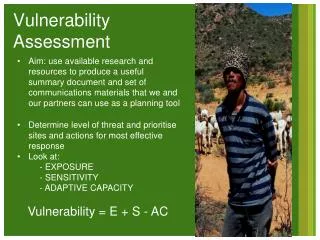
Objective of this study Assessment of social-ecological vulnerability to flooding in Germany at county level forest sector agricultural sector • Work steps: • Conceptual Framework • Development of Indicators • Building a Composite Indicator • Mapping Vulnerability • Problem Definition • Objectives • Concep. Framework • Methodology • Results • Constraints/Outlook
Conceptual Framework (1) • Important elements: • Vulnerability framework • Cross-scale dynamics • Coupled systems • Dynamic feedbacks adapted from Turner et al. 2003
Conceptual Framework (3) Disaster Risk = f (Hazard, Vulnerability) Vulnerability = f (Exposure, Sensitivity, Resilience) Hazard: flood dependent and flood independent characteristics that contribute to flood intensity Vulnerability: Intrinsic and dynamic feature of a system which is driven by environmental, social and economic factors and determines the susceptibility towards a certain hazard • Problem Definition • Objectives • Concep. Framework • Methodology • Results • Constraints/Outlook
Methodology 1. Indicator development - Literature Review - Impact Analysis - Interviews with experts from forest and agricultural sector 2. Building a composite indicator - Data collection (German wide data base) - Statistical Analyses 3. Mapping vulnerability across counties - Geographical Information System (GIS) • Problem Definition • Objectives • Concep. Framework • Methodology • Results • Constraints/Outlook
Composite Indicator Procedure: 1. Data collection 2. Imputation of missing data 3. Scaling and transformation of indicators 4. Data analysis 5. Normalization 6. Weighting (Nardo et al. 2005) • Problem Definition • Objectives • Concep. Framework • Methodology • Results • Constraints/Outlook
Weighting Scheme • Problem Definition • Objectives • Concep. Framework • Methodology • Results • Constraints/Outlook • Criteria • Data quality • Correlations
Composite Indicator Procedure: 1. Data collection 2. Imputation of missing data 3. Scaling and transformation of indicators 4. Data analysis 5. Normalization 6. Weighting 7. Aggregation of indicators (Nardo et al. 2005) • Problem Definition • Objectives • Concep. Framework • Methodology • Results • Constraints/Outlook
Aggregation • Problem Definition • Objectives • Concep. Framework • Methodology • Results • Constraints/Outlook Resilience Vulnerability = E + S+ R
Composite Indicator Procedure: 1. Data collection 2. Imputation of missing data 3. Scaling and transformation of indicators 4. Data analysis 5. Normalization 6. Weighting 7. Aggregation of indicators 8. Visualization 9. Robustness tests (Nardo et al. 2005) • Problem Definition • Objectives • Concep. Framework • Methodology • Results • Constraints/Outlook
Vulnerability Maps • Problem Definition • Objectives • Concep. Framework • Methodology • Results • Constraints/Outlook
Robustness Test (3) • Problem Definition • Objectives • Concep. Framework • Methodology • Results • Constraints/Outlook
Conclusion and Outlook Conclusion: Data availability and accessibility as a main constraint Generalization due to scaling Indicators and methods are robust Approach provides a reliable overview on vulnerable patterns in Germany Outlook: Evaluation and Validation of the approach Risk assessment • Problem Definition • Objectives • Concep. Framework • Methodology • Results • Constraints/Outlook
Thank you for your attention! Contact: damm@ehs.unu.edu