Download
1 / 30
300 likes | 433 Vues
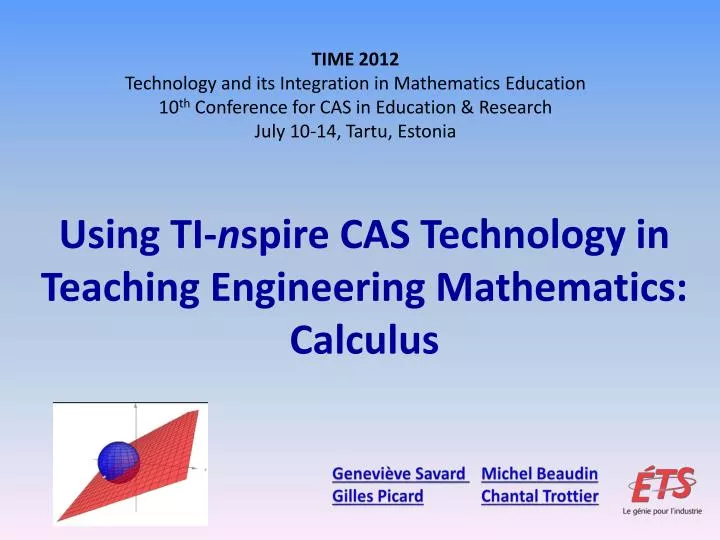
TIME 2012 Technology and its Integration in Mathematics Education 10 th Conference for CAS in Education & Research July 10-14, Tartu , Estonia. Using TI- n spire CAS Technology in Teaching Engineering Mathematics: Calculus. Geneviève Savard Michel Beaudin

E N D
TIME 2012 Technology and its Integration in Mathematics Education 10th Conference for CAS in Education & Research July 10-14, Tartu, Estonia Using TI-nspire CAS Technology in Teaching Engineering Mathematics: Calculus • Geneviève Savard Michel Beaudin • Gilles PicardChantal Trottier
Abstract Using TI-nspire CAS Technology in Teaching Engineering Mathematics: Calculus In September 2011, our engineering school has adopted the TI-nspire CAS CX calculator (and software) for all new students entering bachelor level. With both platforms and integrated facilities, nspire CAS is becoming a more complete solution than Voyage 200. Although we started to use this new device in the classroom, we will face a transition period where both the TI Voyage 200 and the new CX handheld calculators can be found on the students’ desks. This talk will demonstrate examples of how this technology is used in classrooms for our courses in calculus. The nspire CAS CX handheld with its faster CPU and extended graphing capabilities offers us even more options for doing math in our classes. Here are some topics where we can benefit from the use of this new CAS calculator in the single variable course: defining the derivative (at some point f (a)) and using a slider bar to create the function f(x); solving equations, plotting a function defined by an integral and computing Taylor series in a much faster way; the new possibility of animating some optimization problems. For the multiple variables course, we can now work graphically with 2D vectors and plot multiple 3D surfaces; again, the faster CPU allows us to face heavy optimization problems and easily compute multiple integrals. For both calculus courses, the fact that we can now plot different 2D graphs in the same window is a great advantage for teaching and understanding mathematical concepts. As teachers, we are using this technology in two different and complimentary ways: we use it to introduce and explore mathematical concepts and we also want our students to learn some skills in regards to technology. This is now part of the curriculum and will be presented in the talk; also, we will show some examples (taken from exams or take-home work) where the use of nspire CAS (or Voyage 200) technology is required. Pencil and paper techniques are still important and students should also learn to validate manual results using these tools and understand unexpected results obtained by CAS systems. We will show examples where the benefit of using this approach is obvious. Keywords TI-nspire CAS technology, calculator, calculus, optimization, animation.
Overview • About ETS : ourstudents, ourtools • What’s new withnspireCAS? (Since Voyage200) • Examplesin ourcalculus courses • distance from a point to a parabola • short exam question • findingand plotting a spacecurvefrom 2 intersectingsurfaces • animation of vectors and homeworkquestion • Conclusion
About ETS : École de technologiesupérieure Engineering school in Montréal, Québec, Canada Our students come from college technical programs “Engineering for Industry” More than 6300 students, 1500 new students each year All maths teachers and students have the same calculator and textbook
About ETS : Our Tools 1999: TI-92 Plus CAS handheld 2002 : TI Voyage 200 2011 : TI-nspire CAS CX Different softwares (Derive, Maple, Matlab, DPGraph, Geogebra) Only CAS calculators are allowed during exams.
What’s New with TI-nspire? Compared to Voyage 200
What’s New with TI-nspire? Compared to Voyage 200 • 2 platforms • managing documents • list and spreadsheet • fasterprocessor • (better for solve, Taylor, specialfunctions, …) • some CAS improvements • new graphicalcapabilities • animations : powerfultool for teaching • interactive geometry: « experimentalmathematics » • multiple 2D plot window(functions, parametric, scatter plot, etc.) • 3D parametric surfaces and curves (OS 3.2) We will show how we can use some of thesenew featuresin calculus courses
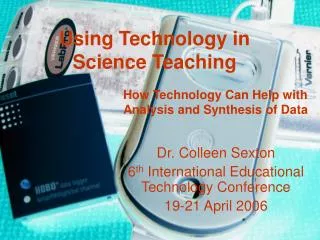
First Example: Optimization Problem QuestionWhich point on the parabola y = x2isclosestto the point P=(½,2)?
Ex. 1Which point on the parabola y = x2isclosest to the point P=(½,2)? Explore the problem graphically
Ex. 1Which point on the parabola y = x2isclosest to the point P=(½,2)? Explore the problem graphically Conceptualise the functionthatshouldbeminimised*
Ex. 1Which point on the parabola y = x2isclosest to the point P=(½, 2)? Explore the problem graphically Conceptualise the functionthatshouldbeminimised* Give the algebraicdefinition of thisfunction Find the minimum value usingcalculus
Ex. 1Which point on the parabola y = x2isclosest to the point P=(½, 2)? Explore the problem graphically Conceptualise the functionthatshouldbeminimised* Give the algebraicdefinition of thisfunction Find the minimum value usingcalculus Compare algebraic and graphicalapproaches
Example 2: An exam question Let C(t)be the concentration of salt in grams per liter (g/L) of a liquidat time t, where t ismeasuredin hours: C(t)=1+(4t − t2) e−t Plot the graph of C(t)for0≤ t ≤ 5. Find the moment, during the 5 first hours, where the concentration isdecreasing the mostrapidly. Use calculus to find the exact value. Don’tforget to show yoursteps.
Example 2: An Exam Question Let C(t)be the concentration of salt in grams per liter (g/L) of a liquidat time t, where t ismeasured in hours: C(t) = 1+(4t − t2) e−t Plot the graph of C(t)for0≤ t ≤ 5. (b) Find the moment, during the 5 first hours, where the concentration isdecreasing the mostrapidly. Use calculus to find the exact value. Don’tforget to show yoursteps. • Technological Goals of Syllabus • Define a function, plot its graph and analyse it. • Use the handheld for computing derivatives and integrals. • Solve an equation, symbolically and numerically.
Example 3: Intersection of Two Surfaces With OS 3.2, we can now plot parametric 3D curves and surfaces. With V200, 3D plotting was restricted to a SINGLE explicit function of type z = z(x, y). So plotting a sphere (spherical coordinates) and a plane in the SAME window can be done. And if someone can find parametric equations for the curve of intersection of these two surfaces, it can be plotted.
Example 3: Intersection of Two Surfaces Let us consider a sphere and a plane: Studentsshouldbe able to produce this:
Example 3: Intersection of Two Surfaces They still need to find the parametric equations themselves. Here are some: (using the “completeSquare” function!) And theycan plot thiscurve:
Example 4: Position and VelocityVectors Withthisanimation of a particlemovementwecan observe that • The position vectorgoesfrom the origin to a point on the trajectory. • The starting point of the velocityvectorisat the end of the vector(convention). • vectoristangent to the trajectory.
Example 4: Position and Velocity Vectors • Whatwillhappen to the velocityvector (in red) at a corner point? • Let us find the exact x-value of this corner point.
How to Createthis Animation? • Parametriccurve • Slider u • Scatter plot (3 points) • Vectors (by connecting the points) • Labels and colors Scatter Plot
Students’ Works (homework) Question 1 a) Plot the trajectoryMoreover, compute and plot the position, velocity and accelerationvectorswhenx = 100, x = 500 and x = 550. Define a vectorfunction. Solve a single equation. Workwithvectorsand matrices. r(t)[1, 1] : element of r(t) in row #1 and column #1.
Students’ Works (homework) Differentiate a vectorfunction. Use a CAS calculator: store variables and functions. Plot parametric 2D curves, points and vectors.
Students’ Works: errors Non-respect of the convention
Students’ Works: errors This velocity vectoris not tangent.
Students’ Works: errors Studentsshowed by computation thatis constant. But thisnormdoesn’t seem constant on the students’ graph: why?
Conclusion • Weappreciatethis new technology. • 2 platforms: veryuseful for us (handheld for exams) • lessens the necessity to use different software • New graphicalpossibilities: • easier exploration • easier validation of resultsobtainedby calculus … or without calculus! However, we must be more specific when designing tasks. • To promote teaching/learning with this technology: • it is required in some commonexam questions • specific technological goals are added in the curriculum • But wewillneverforget the beloved QWERTY keyboard of the old Voyage200!
AitähThankyouMerciKiitosДзякуюGraciasHvalaAitähευχαριστώGrazieDziękujęCпасибоDankeDěkujiChokraneAitähThankyouMerciKiitosДзякуюGraciasHvalaAitähευχαριστώGrazieDziękujęCпасибоDankeDěkujiChokrane • Michel Beaudin Geneviève Savard • Gilles Picard Chantal Trottier • ÉTS, Montréal, Québec, Canada