Download
1 / 17
180 likes | 339 Vues
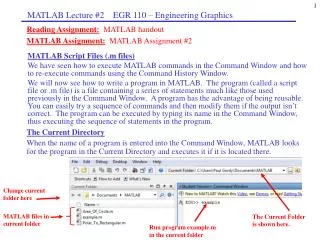
How to use MATLAB (using M-files). Double click this icon To start Matlab 6.5. This is the interactive Matlab window that will appear. Change the directory as shown:. CLICK HERE. CLICK on DESKTOP. How do you start a new M-file in MATLAB window. Do the following: File > New > M-file.

E N D
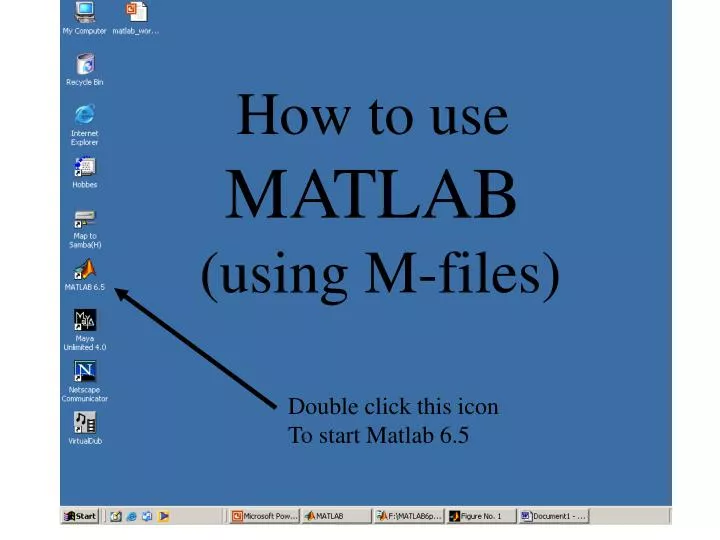
How to use MATLAB (using M-files) Double click this icon To start Matlab 6.5
Change the directory as shown: CLICK HERE CLICK on DESKTOP
How do you start a new M-file in MATLAB window. Do the following: File > New > M-file
This is the window that you get to type in your program (codes)
Type in your program codes in this window. • End each line with; (except the ones you like to see out put) • Use % for comment
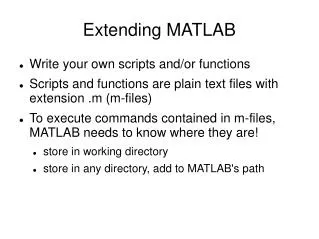
Save your m-files by doing: File > Save As
After saving your M-file, you need to run it by doing the following: Debug > Run
A window will open up with the plot of the three functions, X,Y, Z. Notice that your graph has no title, use “help” command in the MATLAB window to learn how you can add title.
Type in “help plot” in the MATLAB window-- read and learn. >> help plot PLOT Linear plot. PLOT(X,Y) plots vector Y versus vector X. If X or Y is a matrix, then the vector is plotted versus the rows or columns of the matrix, whichever line up. If X is a scalar and Y is a vector, length(Y) disconnected points are plotted. PLOT(Y) plots the columns of Y versus their index. If Y is complex, PLOT(Y) is equivalent to PLOT(real(Y),imag(Y)). In all other uses of PLOT, the imaginary part is ignored. Various line types, plot symbols and colors may be obtained with PLOT(X,Y,S) where S is a character string made from one element from any or all the following 3 columns: b blue . point - solid g green o circle : dotted r red x x-mark -. dashdot c cyan + plus -- dashed m magenta * star y yellow s square k black d diamond v triangle (down) ^ triangle (up) < triangle (left) > triangle (right) p pentagram h hexagram
The rest of the results when you type “help plot”– read and learn. For example, PLOT(X,Y,'c+:') plots a cyan dotted line with a plus at each data point; PLOT(X,Y,'bd') plots blue diamond at each data point but does not draw any line. PLOT(X1,Y1,S1,X2,Y2,S2,X3,Y3,S3,...) combines the plots defined by the (X,Y,S) triples, where the X's and Y's are vectors or matrices and the S's are strings. For example, PLOT(X,Y,'y-',X,Y,'go') plots the data twice, with a solid yellow line interpolating green circles at the data points. The PLOT command, if no color is specified, makes automatic use of the colors specified by the axes ColorOrder property. The default ColorOrder is listed in the table above for color systems where the default is blue for one line, and for multiple lines, to cycle through the first six colors in the table. For monochrome systems, PLOT cycles over the axes LineStyleOrder property. PLOT returns a column vector of handles to LINE objects, one handle per line. The X,Y pairs, or X,Y,S triples, can be followed by parameter/value pairs to specify additional properties of the lines. See also SEMILOGX, SEMILOGY, LOGLOG, PLOTYY, GRID, CLF, CLC, TITLE, XLABEL, YLABEL, AXIS, AXES, HOLD, COLORDEF, LEGEND, SUBPLOT, STEM. >>
Find out how you can use “title” command to add title to your figure. Type “help title” >> help title TITLE Graph title. TITLE('text') adds text at the top of the current axis. See also XLABEL, YLABEL, ZLABEL, TEXT.
After you learn how to use “title” command, use it in your program
Simple Exercise: • Run the following program, using the guidelines • provided in earlier slides. • Include title, xlabel, ylabel • Use help command if necessary • Show output on the monitor to your TA