Download
1 / 16
220 likes | 520 Vues
Histograms Review Mean, median, mode. Grade 8 Math. Minds On. Please define histogram: A graph with bars that show frequencies of data organized into intervals; the intervals line up side by side, without gaps, in the number line.

E N D
Histograms ReviewMean, median, mode Grade 8 Math
Minds On • Please define histogram: • A graph with bars that show frequencies of data organized into intervals; the intervals line up side by side, without gaps, in the number line
Please choose the best graph that can represent the data below: • When you want to display the height of a class to see how many students in one class meet the height requirement required by attractions in Wonderland • A. a bar graph • B. a pictograph • C. a line graph • D. a scatter plot • E. a stem-and-leaf plot • F. a circle graph • G. a Histogram
Please choose the best graph that can represent the data below: • When you want to see how much percentage of Tax is spent on Education: • A. a bar graph • B. a pictograph • C. a line graph • D. a scatter plot • E. a stem-and-leaf plot • F. a circle graph • G. a Histogram
Please choose the best graph that can represent the data below: • When you try to see whether the students in the class prefer hockey or soccer • A. a bar graph • B. a pictograph • C. a line graph • D. a scatter plot • E. a stem-and-leaf plot • F. a circle graph • G. a Histogram
Please choose the best graph that can represent the data below: • When you want to see the biggest improvement time period of a hockey team • A. a bar graph • B. a pictograph • C. a line graph • D. a scatter plot • E. a stem-and-leaf plot • F. a circle graph • G. a Histogram
Please choose the best graph that can represent the data below: • When you want to find out the relationship between two values • A. a bar graph • B. a pictograph • C. a line graph • D. a scatter plot • E. a stem-and-leaf plot • F. a circle graph • G. a Histogram
Please choose the best graph that can represent the data below: • When you want to see how long roughly it takes 32 students to go to school • A. a bar graph • B. a pictograph • C. a line graph • D. a scatter plot • E. a stem-and-leaf plot • F. a circle graph • G. a Histogram
Homework Checking • Please get your homework out • Please find a shoulder partner and exchange your homework • Please check homework 4 and 8
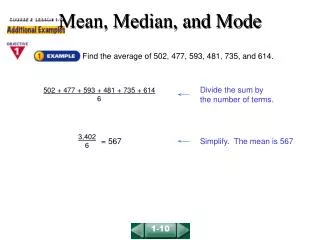
Mean, Median and Mode Grade 8 Math
Definition & Calculation • Mean: • Median: • Mode: 2, 4, 8, 9, 10, 12, 15, 18, 20, 22 • Comparing groups of data by:comparing the mean, median & mode
Experiment • Textbook reading: page 108 • Demonstration: volunteer for dropping and recording? • Calculation: • Mean: • Median: • Mode:
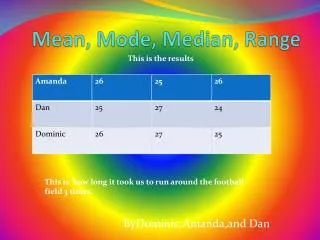
It’s your turn! • Group! • One dropper • One catcher & recorder • Repeat the experiment for 10 times, record the response times down • Switch with your partner, repeat for 1o times, record the response times down • Calculation: • The mean, median and mode (3m) • Drop the least measurement & recalculate the 3m • Drop the greatest measurement & recalculate the 3m • Drop both the least and the greatest & recalculate the 3m
Think: • Was the mean, the median, or the mode affected more by leaving out the least and greatest measurements? Why? • Was the mean, median, or the mode a better indicator of your reaction time? • How did your means, medians, and modes help you compare your reaction time with the reaction times of the other students in your class?
Think: • Textbook Page 110 Question 4
Ticket-Out-Of-The-Door • One new thing that I have learned today Homework • Textbook 109 example 1 & page 110, question 5, 7