Download
1 / 39
390 likes | 526 Vues
Renewable Power Technologies An Overview. National Park Service Western Energy Summit Jan. 21-23, 2003 Phoenix, AZ. Sara Farrar-Nagy National Renewable Energy Laboratory 303-384-7514 sara_farrar-nagy@nrel.gov. Presentation Overview. Renewable Power Sources Wind Solar Photovoltaics

E N D
Renewable Power TechnologiesAn Overview National Park ServiceWestern Energy SummitJan. 21-23, 2003 Phoenix, AZ Sara Farrar-Nagy National Renewable Energy Laboratory 303-384-7514 sara_farrar-nagy@nrel.gov
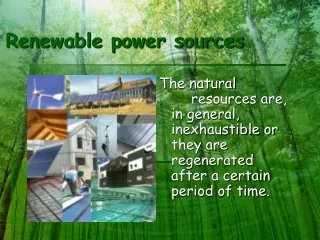
Presentation Overview • Renewable Power Sources • Wind • Solar • Photovoltaics • Concentrating • Geothermal • Biomass • Permitting
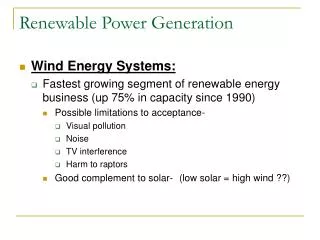
Wind Energy Technology At it’s simplest, the wind turns the turbine’s blades, which spin a shaft connected to a generator that makes electricity. Large turbines can be grouped together to form a wind power plant, which feeds power to the electrical transmission system.
Sizes and Applications • Small (10 kW) • Homes (grid • connected) • Farms • Remote Applications • (e.g. battery changing, water pumping, telecom sites, ice making) • Intermediate • (10-500 kW) • Village Power • Hybrid Systems • Distributed Power • Large (500 kW – 6 MW) • Central Station Wind Farms • Distributed Power • Offshore Wind Generation Stations
Cost of Wind Energy - U.S. 1979: 80 cents/kWh* 2000: 4 - 6 cents/kWh • R&D Advances • Manufacturing Improvements • Increased Turbine Size 2004: 3 - 5 cents/kWh *In year 2000 dollars.
U.S. Wind Market Drivers • Declining Wind Energy Costs • Fuel Price Uncertainty • Federal and State Policies • Economic Development • Green Power • Energy Security
Avian Interactions Research • Data suggest the most significant avian wind-turbine interaction problem in the U.S. is in the Altamont Pass Wind Resource Area. • There is no reason that avian issues should be a concern for future wind farm development; any potential problem should be identified and dealt with before micrositing occurs. • Two guidance documents have been adopted by the NWCC: (1) Permitting of Wind Energy Facilities, and (2) Metrics and Methods for Avian Studies. These two documents serve as guidance for siting and development of new wind farms in the U.S. • Facilities developed following these guidelines have not experienced significant avian impact issues.
Wind Energy – Future Trend • Why Move Offshore? • Higher-quality wind resources • Economies of scale • Proximity to loads • Transmission options • Potential for reducing land use and aesthetic concerns
What are Photovoltaics? Photovoltaics – solid-state technology converts solar radiation into direct current (DC) electricity • Durable: require no moving parts; 25-yr power warranty • Renewable: require only the sun as fuel; run on daylight • Zero Emissions: create virtually no pollutants over life cycle • Material Intensity: Silicon is an abundant material • Recycling: Solar-grade silicon is electronics industry scrap • Energy Intensity: 1-4 Yr energy payback vs. virtually infinite for fossil fuels
1984 1986 1988 1990 1992 1994 1996 1998 2000 2002 2004 PhotovoltaicsFlat-plate System Costs 21.0 Actual prices 19.0 Projected costs 17.0 15.0 13.0 PV system price ($/Wac) 11.0 9.0 7.0 Range of current costs 5.0 3.0
Types of Photovoltaic Power Generator Configurations • Utility grid inter-connected system • PV integrated into UPS • Small stand-alone DC • Stand-alone AC-DC • Stand-alone AC battery • Hybrid generator combination • PV, Wind, Propane, Diesel, Battery Bank
PhotovoltaicsDistributed Energy • Grid-connected buildings PV connected to the grid can offset peak demand, cost, and utility emissions. Adding batteries can provide for emergency power. • Remote facilitiesPV is often cheaper than extending a utility line for sites more than ¼ mile from the utility grid.
PhotovoltaicsBuilding Integrated Disney Wildlife Preserve, Florida Uni-solar PV roofing system – Mt. Evans Observatory, Colorado
PhotovoltaicsDeveloping Technology • Triple-Junction Concentrator Cells • Bifacial (Double-Sided) Modules • Holographic Optics for 3-D Imaging • Wirelessly Harness and Transfer Electricity • Thin Film PV Integration
Concentrating Solar Power • Concentrates sun to very high temperatures • Uses heat to run a typical generator • Requires a very high and direct solar resource • R&D on several technologies • Troughs • Dish/engine systems • Power Towers
Concentrating Solar PowerEmerging Technologies Dish/Engine System Golden, CO Concentrating Trough Mojave Desert, CA
Geothermal Technology Two basic types of geothermal resources: • Hydrothermal Electricity Production • Steam plants – dry orflash steam • Binary-cycle plants • Direct Use • Hot Water Piped directly into facilities for hot water, used to heat buildings, or other applications • Heat Pumps Uses the temperature difference between underground and ambient air to heat and cool buildings 175oC (350oF) 90oC (195oF) 0oC (32oF)
Geothermal Electricity • History • Experiments began in Italy in 1904 • First U.S. plant at The Geysers in 1920s • First U.S. commercial plant in 1960 • Today • 8,000 MWe being generated in 21 countries • 2,800 MWe of electricity supplying 4 million people in western U.S. and Hawaii • Hydrothermal resources could provide additional 20,000 MWe in U.S.
Geothermal EnergyAdvantages • Large domestic resource • Resources last the life of the plant • High plant availability (over 95%) • Provides steady base load power • Relatively low cost (4-8 ¢/kWh) • Growing market • 50 times less emissions than traditional, fossil-fuel power plants
GeothermalDevelopments & Issues • New Developments • Mineral recovery combined with geothermal power at Salton Sea, silica recovery at Dixie Valley • Advances in condenser, heat exchanger coating, and evaporative pre-cooling technology • Siting Issues • Lack of federal policy to promoting geothermal • Redundant EA and EIS processes • Lack of data on impacts
Geothermal ElectricityImpacts & Measures • Drilling & Developing • Use air-cooled and low-profile equipment • Apply proper techniques • Production Operation • Maintain reservoir pressures, use appropriate discharge rates • Binary plants return all geothermal fluid to the ground • Air-cooled plants release no water vapor
Geothermal Heat PumpSmall Commercial & Residential Bldgs • Circulates fluid through ground system • Transfers heat to ground in summer, from ground in winter • 400,000 systems currently in U.S.
Geothermal Heat PumpBenefits • Can be used almost everywhere worldwide • Are energy- and cost-efficient • Conserve fossil fuel resources • Provide clean heating and cooling -no emissions from burning fuels
Energy Facility Siting & Permitting • Process varies from state-to-state • Process requires multiple steps, generally including: - Formal request submitted to the permitting agency with a statement qualifying the practical need for the facility - Early public notice - Public hearings with extended comment periods - Formal review and decision by the permitting agency - Set period of time to file appeals before the agency’s decision is considered final
Flowchart of the Oregon Energy Facility Standard Siting Process Source: Oregon Office of Energy 625 Marion St. N.E. Salem, Oregon 97301 503-378-4040 Toll Free (Oregon only): 1-800-221-8035 Email: energy.in.internet@state.or.us
Flowchart of the Oregon Energy Facility Expedited Siting Process (for Special Criteria Facilities) Source: Oregon Office of Energy 625 Marion St. N.E. Salem, Oregon 97301 503-378-4040 Toll Free (Oregon only): 1-800-221-8035 Email: energy.in.internet@state.or.us
Environmental Permitting in New Mexico Conduct evaluation to include testing and inspections Disapprove or approve with stated conditions Exercise signature authority Inform requester Process appeal of denial Forward for compliance monitoring • Requester applies • Application evaluated for completeness • Filing fees collected • Develop plan for evaluation of application • Determine need for public notice • Determine need for public hearing • Accept public input
Resources for Renewables • State Energy Alternatives www.eren.doe.gov/state_energy • Permitting/Siting Activity Resources Handout: Key Contacts Partial List: AZ, ID, MT, NV, OR, UT, WA
Permitting ProcessThe Bottom Line • Time intensive • Generally includes multiple public announcements and public comment opportunities • Involvement is best achieved through direct contact with agency officials