Download
1 / 16
160 likes | 259 Vues
The Impact of Observation Localization on South Plains Convective Forecasts. 6 th EnKF Workshop May 2014 Brock Burghardt , Brian Ancell Atmospheric Science Group Dept. of Geosciences. Why do this?. Optimize forecast accuracy of South Plains convective events for ESA investigation

E N D
The Impact of Observation Localization on South Plains Convective Forecasts 6thEnKF Workshop May 2014 Brock Burghardt, Brian Ancell Atmospheric Science Group Dept. of Geosciences
Why do this? • Optimize forecast accuracy of South Plains convective events for ESA investigation • Improve warm-season convective forecast performance in TTU RT EnKF • Assess localization cutoff impact using an object-based approach to verify rainfall • Preliminary step in verifying convective-scale details • Implement into RT EnKF system for precipitation verification
Motivation • Limited literature addressing optimal localization covariance cutoff in atmospheric modeling. • Would expect some correlation with model grid spacing and length scale of phenomena (Hamill et al. 2001) • Sobash and Stensrud (2013) find localization cutoff values on order of 10 km yield most accurate forecast solutions in convective OSSEs of an MCS over Oklahoma (assimilating simulated radar data) • Initial testing of radii during TTU EnKF system development showed some differences in verification metrics (Ancell)
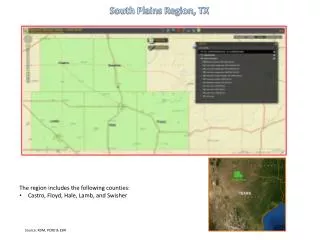
Methodology • Select significant convective events places across the Southern Plains (occurring within innermost domain) • Vary localization radius (half-width) cutoff radius in inner two domains • Using a Gaspari-Cohn distance cutoff function • Optimize D2 vary D3 (traditional & object statistics) • Focusing on day 1 (0-24h) forecast
Model Domain and Configuration • WRF-ARW v3.5.1 • GFS analysis/forecasts used for D1 ICs/LBCs • Hourly state output d01: dx=36 km d02: dx=12 km d03 : dx=4 km 38 vert. levels
Ensemble Background • DART EAKF system (Anderson 2001, et al. 2009) • 50 members (all domains) utilizing adap. inflation • Initialized using WRF-VAR v3.5.1 background error covariance climatology (cv3) • MADIS obs filtered into 6 h forecast background • Gaspari-Cohn cutoff function for localization covariance t= -30 h t= 0 h t= 24/30 h t= -54 h Integrate full forecast Cycle all domains Cycle D1 Nest down D2, D3 MADIS data obtained from: http://madis.noaa.gov
Verification D3 (varied D2 radius) Time mean RMSE Time mean RMSE
Verification D2 Time mean RMSE Time mean RMSE
Object-based verification • Follows work of Davis et al. 2006 a,b, Burghardt et al. 2014 • Using total forecast time rainfall • Matching is based on lowest distance and area difference error • Objects constrained to max distance error of 500 km Stage IV rainfall data obtained from: www.emc.ncep.noaa.gov/mmb/ylin/pcpanl/stage4
Rainfall objects for case 1 Member 30 (best net member) from D2 r=300 km
Continuing work and ideas • More simulations of varied r values. • More cases (~10) • Look at impact of localization radius on ESA (do meso-beta –gamma -scale flow features exhibiting sensitivity diminish with decreasing radius?) • Using 1-h time tracking object algorithm • Applying algorithm to archived TTU RT EnKF precipitation forecasts
Takeaway points • Some evidence larger localization radius values (relative to initial values on D2) improve mesoscale and convective-scale forecast details. • Tendency for model to produce too many net rainfall objects that are smaller than observed. Any suggestions, recommendations? Email: brock.burghardt@ttu.edu