Download
1 / 1
10 likes | 113 Vues
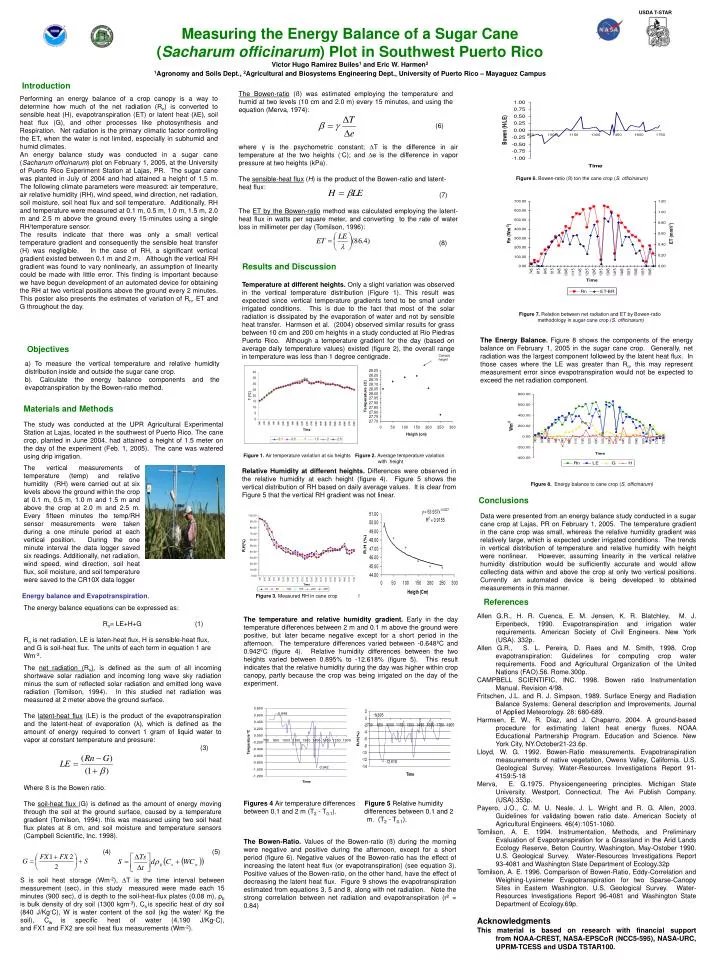
USDA T-STAR. Measuring the Energy Balance of a Sugar Cane ( Sacharum officinarum ) Plot in Southwest Puerto Rico Victor Hugo Ramirez Builes 1 and Eric W. Harmen 2 1 Agronomy and Soils Dept., 2 Agricultural and Biosystems Engineering Dept., University of Puerto Rico – Mayaguez Campus.

E N D
USDA T-STAR Measuring the EnergyBalance of a Sugar Cane (Sacharum officinarum) Plot in Southwest Puerto Rico Victor Hugo Ramirez Builes1 and Eric W. Harmen2 1Agronomy and Soils Dept., 2Agricultural and Biosystems Engineering Dept., University of Puerto Rico – Mayaguez Campus Introduction The Bowen-ratio (ß) was estimated employing the temperature and humid at two levels (10 cm and 2.0 m) every 15 minutes, and using the equation (Merva, 1974): (6) Performing an energy balance of a crop canopy is a way to determine how much of the net radiation (Rn) is converted to sensible heat (H), evapotranspiration (ET) or latent heat (λE), soil heat flux (G), and other processes like photosynthesis and Respiration. Net radiation is the primary climatic factor controlling the ET, when the water is not limited, especially in subhumid and humid climates. An energy balance study was conducted in a sugar cane (Sacharum officinarum) plot on February 1, 2005, at the University of Puerto Rico Experiment Station at Lajas, PR. The sugar cane was planted in July of 2004 and had attained a height of 1.5 m. The following climate parameters were measured: air temperature, air relative humidity (RH), wind speed, wind direction, net radiation, soil moisture, soil heat flux and soil temperature. Additionally, RH and temperature were measured at 0.1 m, 0.5 m, 1.0 m, 1.5 m, 2.0 m and 2.5 m above the ground every 15-minutes using a single RH/temperature sensor. The results indicate that there was only a small vertical temperature gradient and consequently the sensible heat transfer (H) was negligible. In the case of RH, a significant vertical gradient existed between 0.1 m and 2 m. Although the vertical RH gradient was found to vary nonlinearly, an assumption of linearity could be made with little error. This finding is important because we have begun development of an automated device for obtaining the RH at two vertical positions above the ground every 2 minutes. This poster also presents the estimates of variation of Rn, ET and G throughout the day. where γ is the psychometric constant; ∆T is the difference in air temperature at the two heights (◦C); and ∆e is the difference in vapor pressure at two heights (kPa). The sensible-heat flux (H) is the product of the Bowen-ratio and latent-heat flux: (7) The ET by the Bowen-ratio method was calculated employing the latent-heat flux in watts per square meter, and converting to the rate of water loss in millimeter per day (Tomilson, 1996): (8) Figure 6. Bowen-ratio (ß) ton the cane crop (S. officinarum) Results and Discussion Temperature at different heights. Only a slight variation was observed in the vertical temperature distribution (Figure 1). This result was expected since vertical temperature gradients tend to be small under irrigated conditions. This is due to the fact that most of the solar radiation is dissipated by the evaporation of water and not by sensible heat transfer. Harmsen et al. (2004) observed similar results for grass between 10 cm and 200 cm heights in a study conducted at Rio Piedras Puerto Rico. Although a temperature gradient for the day (based on average daily temperature values) existed (figure 2), the overall range in temperature was less than 1 degree centigrade. Figure 1. Air temperature variation at six heights Figure 2. Average temperature variation with height Figure 7. Relation between net radiation and ET by Bowen-ratio methodology in sugar cane crop (S. officinarum) The Energy Balance. Figure 8 shows the components of the energy balance on February 1, 2005 in the sugar cane crop. Generally, net radiation was the largest component followed by the latent heat flux. In those cases where the LE was greater than Rn, this may represent measurement error since evapotranspiration would not be expected to exceed the net radiation component. Objectives Canopy height a) To measure the vertical temperature and relative humidity distribution inside and outside the sugar cane crop. b). Calculate the energy balance components and the evapotranspiration by the Bowen-ratio method. Materials and Methods The study was conducted at the UPR Agricultural Experimental Station at Lajas, located in the southwest of Puerto Rico. The cane crop, planted in June 2004, had attained a height of 1.5 meter on the day of the experiment (Feb. 1, 2005). The cane was watered using drip irrigation. The verticalmeasurements of temperature (temp) and relative humidity (RH) were carried out at six levels above the ground within the crop at 0.1 m, 0.5 m, 1.0 m and 1.5 m and above the crop at 2.0 m and 2.5 m. Every fifteen minutes the temp/RH sensor measurements were taken during a one minute period at each vertical position. During the one minute interval the data logger saved six readings. Additionally, net radiation, wind speed, wind direction, soil heat flux, soil moisture, and soil temperature were saved to the CR10X data logger Relative Humidity at different heights. Differences were observed in the relative humidity at each height (figure 4). Figure 5 shows the vertical distribution of RH based on daily average values. It is clear from Figure 5 that the vertical RH gradient was not linear. Figure 3. Measured RH in cane crop Figure 5. Comport of RH with height Figure 8. Energy balance to cane crop (S. officinarum) Conclusions Data were presented from an energy balance study conducted in a sugar cane crop at Lajas, PR on February 1, 2005. The temperature gradient in the cane crop was small, whereas the relative humidity gradient was relatively large, which is expected under irrigated conditions. The trends in vertical distribution of temperature and relative humidity with height were nonlinear. However, assuming linearity in the vertical relative humidity distribution would be sufficiently accurate and would allow collecting data within and above the crop at only two vertical positions. Currently an automated device is being developed to obtained measurements in this manner. Energy balance and Evapotranspiration. References The energy balance equations can be expressed as: Rn= LE+H+G (1) Rn is net radiation, LE is laten-heat flux, H is sensible-heat flux, and G is soil-heat flux. The units of each term in equation 1 are Wm-2. Allen G.R., H. R. Cuenca, E. M. Jensen, K. R. Blatchley, M. J. Erpenbeck, 1990. Evapotranspiration and irrigation water requirements. American Society of Civil Engineers. New York (USA). 332p. Allen G.R., S. L. Pereira, D. Raes and M. Smith, 1998. Crop evapotranspiration: Guidelines for computing crop water requirements. Food and Agricultural Organization of the United Nations (FAO).56. Rome.300p. CAMPBELL SCIENTIFIC, INC. 1998. Bowen ratio Instrumentation Manual. Revision 4/98. Fritschen, J.L. and R. J. Simpson, 1989. Surface Energy and Radiation Balance Systems: General description and Improvements. Journal of Applied Meteorology. 28: 680-689. Harmsen, E. W., R. Diaz, and J. Chaparro, 2004. A ground-based procedure for estimating latent heat energy fluxes. NOAA Educational Partnership Program. Education and Science. New York City, NY.October21-23.6p. Lloyd, W. G. 1992. Bowen-Ratio measurements. Evapotranspiration measurements of native vegetation, Owens Valley, California. U.S. Geological Survey. Water-Resources Investigations Report 91-4159:5-18 Merva, E. G.1975. Physioengeneering principles. Michigan State University. Westport, Connecticut. The Avi Publish Company. (USA).353p. Payero, J.O., C. M. U. Neale, J. L. Wright and R. G. Allen, 2003. Guidelines for validating bowen ratio date. American Society of Agricultural Engineers. 46(4):1051-1060. Tomilson, A. E. 1994. Instrumentation, Methods, and Preliminary Evaluation of Evapotranspiration for a Grassland in the Arid Lands Ecology Reserve, Beton Country, Washington, May-Ostober 1990. U.S. Geological Survey. Water-Resources Investigations Report 93-4081 and Washington State Department of Ecology.32p Tomilson, A. E. 1996. Comparison of Bowen-Ratio, Eddy-Correlation and Weighing-Lysimeter Evapotranspiration for two Sparse-Canopy Sites in Eastern Washington. U.S. Geological Survey. Water-Resources Investigations Report 96-4081 and Washington State Department of Ecology.69p. Acknowledgments This material is based on research with financial support from NOAA-CREST, NASA-EPSCoR (NCC5-595), NASA-URC, UPRM-TCESS and USDA TSTAR100. The temperature and relative humidity gradient. Early in the day temperature differences between 2 m and 0.1 m above the ground were positive, but later became negative except for a short period in the afternoon. The temperature differences varied between -0.648ºC and 0.942ºC (figure 4). Relative humidity differences between the two heights varied between 0.895% to -12.618% (figure 5). This result indicates that the relative humidity during the day was higher within crop canopy, partly because the crop was being irrigated on the day of the experiment. Figures 4 Air temperature differences Figure 5 Relative humidity between 0.1 and 2 m (T2 - T0.1). differences between 0.1 and 2 m. (T2 - T0.1). The net radiation (Rn), is defined as the sum of all incoming shortwave solar radiation and incoming long wave sky radiation minus the sum of reflected solar radiation and emitted long wave radiation (Tomilson, 1994). In this studied net radiation was measured at 2 meter above the ground surface. The latent-heat flux (LE) is the product of the evapotranspiration and the latent-heat of evaporation (λ), which is defined as the amount of energy required to convert 1 gram of liquid water to vapor at constant temperature and pressure: (3) Where ß is the Bowen ratio. The soil-heat flux (G) is defined as the amount of energy moving through the soil at the ground surface, caused by a temperature gradient (Tomilson, 1994). this was measured using two soil heat flux plates at 8 cm, and soil moisture and temperature sensors (Campbell Scientific, Inc. 1998). (4) (5) The Bowen-Ratio. Values of the Bowen-ratio (ß) during the morning were negative and positive during the afternoon, except for a short period (figure 6). Negative values of the Bowen-ratio has the effect of increasing the latent heat flux (or evapotranspiration) (see equation 3). Positive values of the Bowen-ratio, on the other hand, have the effect of decreasing the latent heat flux. Figure 9 shows the evapotranspiration estimated from equations 3, 5 and 8, along with net radiation. Note the strong correlation between net radiation and evapotranspiration (r2 = 0.84) S is soil heat storage (Wm-2), ∆T is the time interval between measurement (sec), in this study measured were made each 15 minutes (900 sec), d is depth to the soil-heat-flux plates (0.08 m), ρb is bulk density of dry soil (1300 kgm-3), Cs is specific heat of dry soil (840 J/Kg◦C), W is water content of the soil (kg the water/ Kg the soil), Cw is specific heat of water (4,190 J/Kg◦C), and FX1 and FX2 are soil heat flux measurements (Wm-2).