Download
1 / 15
150 likes | 347 Vues
Evaluate IEEE 802.11e EDCA Performance. Tyler Ngo CMPE 257. EDCA vs. DCF. EDCA classifies traffic flows in different access categories (AC). Modifiable MAC parameters include: Arbitration Interframe Space (AIFS) replaces the DIFS in IEEE 802.11. Minimum Contention Window (CWmin).

E N D
Evaluate IEEE 802.11e EDCA Performance Tyler Ngo CMPE 257
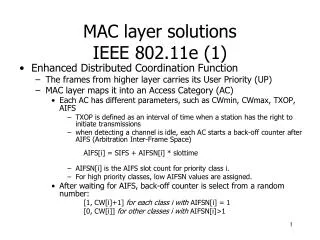
EDCA vs. DCF • EDCA classifies traffic flows in different access categories (AC). • Modifiable MAC parameters include: • Arbitration Interframe Space (AIFS) replaces the DIFS in IEEE 802.11. • Minimum Contention Window (CWmin). • Maximum Contention Window (CWmax). • Transmission Opportunity (TXOP). • Shorter CW and AIFS for higher-priority traffic.
Analytical Modeling Transmission Probability • Let W = CWmin, then CWmax = W * 2m, where m is the maximum backoff stage. • Let ρc be the probability that a packet of class c encounters a collision on the channel. Let τc be the probability that a station of class c transmit in a random chosen slot. Then:
Analytical Modeling Throughput • Let ρtr be the probability that there is at least one transmission in the considered slot time. Then: • Let ρs,i be the probability that a transmission of a packet of node i occurring on the channel is successful. Let τj be the probability that a node j transmit data (j ≠ i, j = [1, n]). Then:
Analytical Modeling Throughput, Cont. • Let Ts,c be the average time that a node of class c senses the channel busy because of a successful transmission, TC,c be the average time that a node of class c senses the channel busy during a collision. Let E[P] be the expected packet length, H = PHYhdr + MAChdr be the packet header, δ be the propagation delay, and α be the length of a slot time. Then: • The throughput of node i, Si is then:
Simulation Modeling • Controlled Parameters: • Loss Model: Log Distance • Exponent = 3 • Reference Distance = 1 • Reference Loss: 46.67 • Delay Model: Random, Uniform variable; Constant speed. • Nist Error Rate Model • Transmission Range • Energy Detection Threshold: -96.0 • CCA Mode1 Threshold: -99.0 • Tx Power End/Start: 16.0206 • Routing Protocol: OLSR • TCP Protocol: New Reno • Data Rate: 5MB/s • Run time = ~100s • TCP Packet Size = 1024 • UDP Packet Size = 120
Topology 1 • Traffic: 6 7; 9 1; 3 8; 5 2 • Total run duration: 100s
Topology 2 • Traffic: • 6 7; • 9 1; • 3 8; • 5 2; • Total run duration: 100s
Topology 3 • Traffic: • 6 7; • 9 1; • 3 8; • 5 2; • Total run duration: 100s • Mobile environment only • Gaussian Markov Mobility Model
Conclusion • Higher-priority tagging improves throughputs. But… • What are the rules for tagging? • TCP starvation is the main issue.