Download
1 / 29
290 likes | 391 Vues
Regulation and the Role of Government in SHI and VHI Dr. Pablo Gottret Senior Economist Health, Nutrition and Population April 2004. The Millennium Development Goals (MDGs). In the 1990s The Global Community Made a Pledge to Help Developing Countries Achieve the MDGs.

E N D
Regulation and the Role of Government in SHI and VHI Dr. Pablo Gottret Senior Economist Health, Nutrition and Population April 2004
The Millennium Development Goals (MDGs) In the 1990sThe Global Community Made a Pledge to HelpDeveloping Countries Achieve the MDGs
Millennium Development Goals(MDG) • Extreme Poverty: • Halve, between 1990 and 2015, the proportion of people whose income is less than $1 a day. • Halve, between 1990 and 2015, the proportion of people who suffer from hunger. • Safe Water & Sanitation: • Halve by 2015 the proportion of people without sustainable access to safe drinking water. • By 2020, achieve significant improvement in the proportion of people with access to sanitation. • Child & Maternal Health: • Reduce by two thirds, between 1990 and 2015, the under-five mortality rate. • Reduce by three quarters, between 1990 and 2015, the maternal mortality ratio. • Primary & Girls' Education: • By 2015, boys and girls everywhere complete a full course of primary schooling. • Eliminate gender disparity in primary and secondary education, preferably by 2005, and in all levels of education no later than 2015. • Communicable Diseases • By 2015, halt and begin to reverse • the spread of: • HIV/AIDS • Malaria & • Other major diseases.
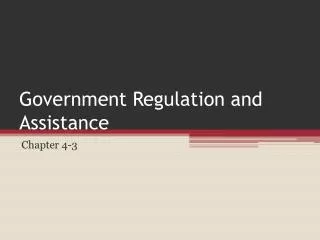
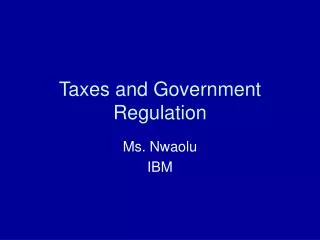
Reduce Child Mortality Improve Maternal Health Reduce child mortality Under Five Mortality Births attended by skilled health personnel(% total) (per 1,000 live births) 100 100 90 86 80 80 78 60 60 51 47 40 40 29 20 20 0 0 1988 2015 1990 1999 2015 Millennium Development Goals Global Aggregates
Children of Poor Families Are Worse Off
Governance Financing Outcomes Capacity Financing Policies withGood Governance andLocal CapacityAllow Countries to Leverage Outcomes
When Good Policies and Capacity are MissingThings Break Down: • Policy • Information/M&E • Capacity • Household Behaviors • Institutional Incentives • Financing Weak Policies & Corruption Lack of Community Involvement Problems with Supply Money Alone Outcomes Outcomes Lack of Demand Government Local Gov. Providers Individuals Benefits
Let us Look at a Few Numbers • Global GDP • US$31 Trillion (3 - 4 percent Growth Rate) • Global Health Spending • US$2.6 Trillion (8 percent of Global GDP) • Spending In Developing Countries • US$280 Billion (11 percent of total spending)
Only 11 Percent of Global Spending for 90 Percent of the World’s Population
Taxes Government Agency Public Charges Public Providers Social Insurance or Sickness Funds Mandates Private Insurance Organizations Grants Private Providers Loans Employers Private Insurance Individuals And Households Communities Out-of-Pocket What are Good Health Financing Policies? Revenue Pooling Resource Allocation Collection or Purchasing (RAP) Service Provision Public Private
Understanding Rich Poor Differences in Health Care Financing • Revenue Collection • Difficulties reaching rural & informal sectors • Weak Taxation Capacity • Pooling • Incomplete and fragmented revenue pool • Incomplete and fragmented sharing of risks • Resource Allocation and Purchasing • Public subsidies often have pro-rich bias • The poor often bypass formal sector providers
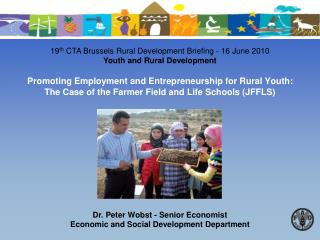
Low-Income Countries HaveWeak Capacity to Raise Public Revenues 100 • Governments in many countries often raise less than 20% of GDP in public revenues; and 80 60 Total Government Revenues as % GDP 40 • The tax structure in many low-income countries is often regressive. 20 0 100,000 100 1,000 10,000 Per capita GDP (Log scale)
Cross subsidy from productive to non-productive part of the life cycle Cross-subsidy fromrich to poor Cross-subsidy from low-risk to high-risk $ $ $ $ $ $ High risk Non-productive Productive Rich Low risk Poor What do We Mean by Pooling? Resource endowment Resource endowment Resource endowment Health risk Income Age
Low Income Countries Have Less Pooling of Revenues Share of world’s 1.3 billion living on less than US$1 day indicated by size of blue bubbles
Low-Income Countries Have Pro-Rich Bias of Public Subsidies Subsidies (%) Government health expenditure)
What is a Typical Financing Scheme in a Developing Country • Segmented Financing System • Limited public health and concentration of expenditures in supply side subsidies to curative care (large public hospitals) • Social Insurance with low coverage usually concentrated in middle and upper class urban population (salaried workers) • Communities have responded with community risk pooling mechanisms. • Limited supplementary insurance for those who can afford it • There is no package to supplement • Unclear rules of the game • Little development of Capital markets and prohibition to invest abroad • Mandatory requirements to be a fully complying insurance company in the country. • Large out of pocket payments for curative care, usually paid by lower income families.
Domestic Financed Gov. Expenditures (Central Gv. + SHI) varies across countries for any level of GDP
Private Expenditure in Health is More Important, specially in Low Income Settings Source: WDI, 2002 Notes: Regional aggregates exclude high-income countries (GNI per capita > $9,206); MENA health expenditures include Saudi Arabia and Oman, which are both considered upper middle-income countries according to World Bank specifications.
Some Illustrative Numbers (in %, data for year 2001) India Bolivia Rwanda Thailand THE / GDP 5.1 5.3 5.5 3.7 Public H. Exp. / THE 17.9 66.3 55.5 57.1 Social H. Exp THE N.A. 35.0 0.4 14.9 Coverage / Population 1.0 21.0 1.4 N.A. Private H. Exp / THE 82.1 33.7 44.5 42.9 OOP / Private H. Exp 99.0 82.0 N.A. 85.0 THE = Total Health Expenditure OOP = Out of Pocket Expenditures N.A. = Not Available Source: WHO
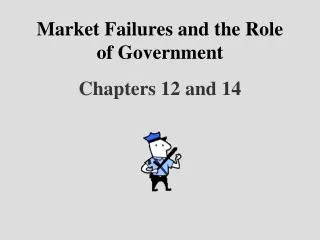
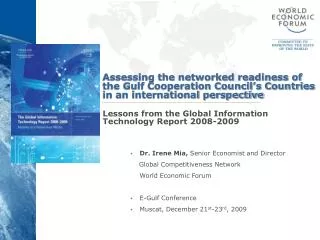
MODELS – FLOW OF FUNDS CLASSIC FRAGMENTED MODEL of SHI Gral. Gov. Indiv./firms 1 Indiv./Firms 2 MOH SIF 1 SIF 2 Pmoh P3 P2 Psif1 Psif2 EXAMPLES Mexico, Bolivia, Peru, Ecuador Typical Problems: Inefficiency, duplication of infrastructure, duplication of Coverage, low coverage breadth MOH, low coverage depth, Equity, supply side subsidies, subsidies to middle/upper class
MODELS – FLOW OF FUNDS SINGLE PAYER Indiv./ Firms Gral. Gov Social Insurance Fund P 1 P 3 P 2 P4 TYPICAL PROBLEMS: Cost containment, deficits, transparency/accountability, possible lack of competition EXAMPLES: Costa Rica, Canada, Taiwan, Korea, Estonia, Hungary
MODELS – FLOW OF FUNDS Managed Care -- Argentina Indiv. /Firms Collector High Complexity Fund Solidarity Fund OS 1 OS 2 OS 3 P1 P3 P3 P5 P4 P2 P3 P2 PROBLEMS: Risk selection, double coverage, transparency/accountability, supervision/control, high administrative costs
MODELS – FLOW OF FUNDS Managed Care -- Colombia Gral. Gov. Indiv./Firms Social Ins. Fund EPS 1 EPS 2 ARS 1 ARS 2 P3 P1 P5 P4 P2 P1 P3 P2 P2 PROBLEMS: Administrative costs, targeting, equity, risk selection.
MODELS – FLOW OF FUNDS Managed Care -- Chile Indiv./ Firms Lower Income Indiv./ Firms Higher Income FONASA ISAPRE 1 ISAPRE 2 ISAPRE 3 P1 P2 P5 P4 P3 P1 P2 P5 P3 P4 PROBLEMS: Equity, risk selection, perverse incentives from opting out, high administrative costs, subsidies to upper income
Regulation will Vary Depending on Assumed Risk Among Others • Entitlement, Enrollment and portability • Degree of Mobility of insured population • Minimum entry requirements to industry • Solvency margins and prudential regulation (reserves, investment of reserves, financial disclosure actuarial studies, corporate governance, others) • Consumer protection and disclosure (complaints and periodic and public information requirements) • Exit mechanisms (intervention, liquidation, others) • Regulation related to market failures (adverse selection, risk selection and moral hazard)
Will More Money Alone Help Achieve the MDG? • There are estimates that to achieve MDG there is a need of additional funding for health expenditures in the range of US$ 30 to 80 billion. • It is unlikely that this money will come from donor financing alone and if it did it would be non-sustainable. • Donor financing must leverage structural change.
What is it Needed in Financing to Achieve MDG? • A sustainable Financing Strategy per Country • Understanding Health as a System • Clear and complementary roles for Public Sector, Social Insurance, Community Risk Pooling Mechanisms, Private Insurance and Out of Pocket Payments. • Clear and sustaining rules of the game all across.
No Single Actor Can do it Alone Private Sector Public Sector Better Financial Protection In Health NGOs and International Partners Individuals and Households Insurers