Download
1 / 27
270 likes | 403 Vues
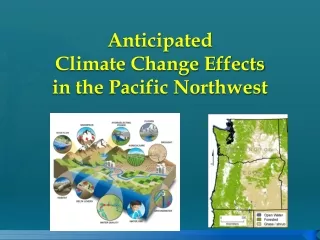
Pacific Northwest Climate Change and Expected Impacts. Eric Salathé salathe@washington.edu Climate Impacts Group University of Washington . 3.6°F 2.7°F 1.8°F 0.9°F. Some year-by-year data. Global Climate System Model.

E N D
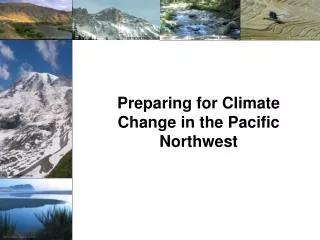
Pacific Northwest Climate Change and Expected Impacts Eric Salathé salathe@washington.eduClimate Impacts GroupUniversity of Washington
3.6°F 2.7°F 1.8°F 0.9°F
Range of Projected Climate Change for the Pacific Northwest from Latest IPCC Climate Simulations
(2-10 ºF) (1.6-4.3 ºF) (0.7-1.8 ºF)
Reference Scenarios Three Scenarios that represent the range of expected changes for use in detailed impacts studies: ECHAM5-A2 - Mid-range IPSL-A2 -- High change GISS-B1 -- Low change +30% -30%
SUMMARY • Projected Pacific Northwest warming: 1/4 to 1 ºF/decade • Probably more warming in Summer than Winter • Precipitation changes uncertain – Possibly wetter winters and drier summers
Downscaling Methods Used in CIG Empirical Downscaling • Assumes climate model captures temperature and precipitation trends • Quick: Can do many scenarios •Shares uncertainties with global models • Regional Climate Model • Based on MM5 regional weather model • Represents regional weather processes • May produce local trends not depicted by global models • Additional modeling layer adds bias and uncertainty
Washington’s economy and natural resources are sensitive to climate changes • “drought” – a water supply shortage – is our region’s greatest climate vulnerability
The main impact of a warmer climate: LESS SNOW for a ~3.6°F (2°C) warming Snoqualmie Pass 3022 ft
Springtime snowpack will decline, especially at the warmest locations + 4.1 ºF (2.3 ºC) & + 4.5% winter precipitation +2.3C, +4.5% winter precip
Springtime snowpack will decline, especially at the warmest locations + 4.1°F + 4.5% winter precip
Western Washington Precip Oct Feb Jun +3.6 to +5.4°F (+2 to +3°C) Streamflow depends on Snowpack
2000 climate +4.1 ºF Reduced spring & summer flows Increased winter flows Impacts on Seattle’s water supply • reduced summertime inflows, increasing the size and extending the time of the summertime inflow-demand deficit • this is common to all our region’s municipal (surface) water supplies Oct Dec Feb Apr Jun Aug Wiley (2004)
Factors driving Portland Oregon’s future water supply Bull Run Watershed Climate change: supply drops by ~16% Projected population growth increases demand: +66% Warmer temperatures increase demand +18% Including the 2040s scenario for climate change impacts increases projected future supply needs by ~50% of the amount needed to meet population growth alone. Palmer and Hahn (2004)
Climate impacts on salmon must be added to existing stresses across their full life-cycle
Climate impacts on salmon must be added to existing stresses across their full life-cycle HABITAT CHANGE and DEGRADATION INCLUDING GLOBAL WARMING HARVEST PRACTICES HATCHERY PRACTICES
Climate change impacts on Washington’s forests • CO2 fertilization • A transient impact • a longer dry season • reduced regeneration, increased vulnerability to fires and pests (except in especially cool-wet locations) • shifts in species ranges • subalpine forests “invading” alpine meadows; a northward march--or a loss--of species?
Climate change sharpens the tradeoffs in a world of multiple stresses • climate change will likely intensify existing conflicts over scarce natural resources • most of our natural resources are now fully allocated and managers already grapple with difficult tradeoffs • summer water supplies for in and out of stream uses are especially vulnerable to climate warming • global warming impacts on Washington depend on both the climate change and on how we prepare
Correspondence of Temperature and Precipitation Trends Déry & Wood, Geophys Res Lett, 2005
Stormtrack and Climate Change: Influence on Precipitation J Yin, Geophys Res Lett, 2005
Stormtrack and Climate Change: Influence on Precipitation J Yin, Geophys Res Lett, 2005