Download
1 / 16
160 likes | 170 Vues
Explore the impact of the Bárðarbunga fissure eruption on volcanic haze and sulfur dioxide (SO2) formation. Study the complexities of satellite observations and the relation between SO2 and aerosols.

E N D
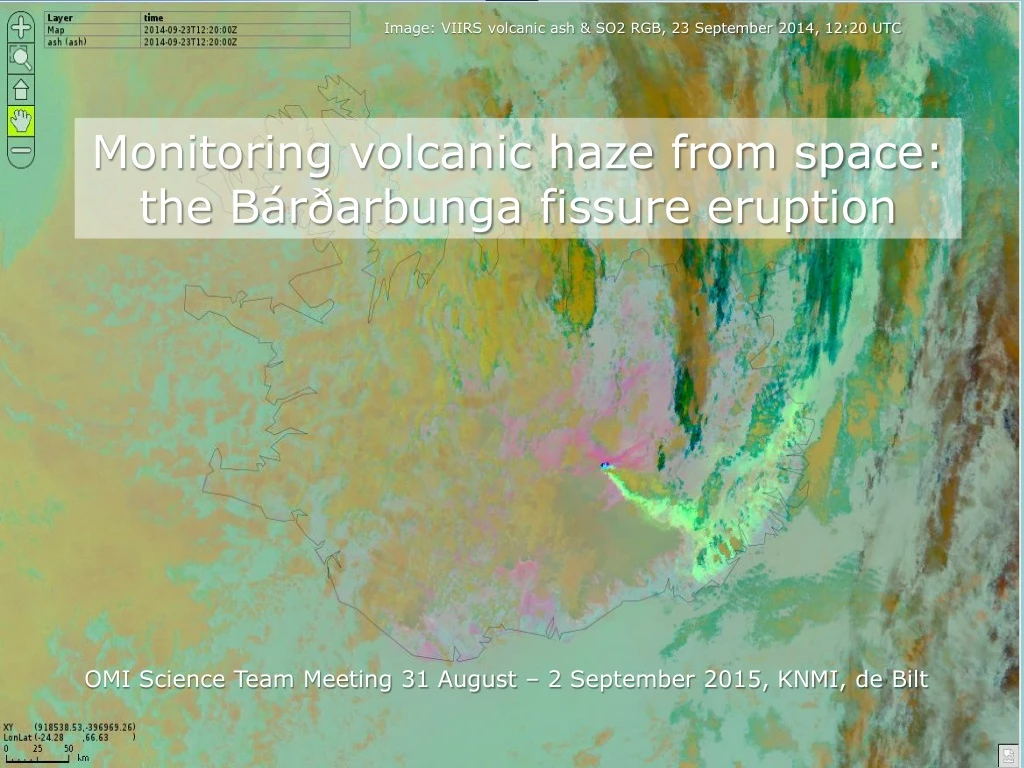
Image: VIIRS volcanic ash & SO2 RGB, 23 September 2014, 12:20 UTC Monitoring volcanic haze from space: the Bárðarbunga fissure eruption OMI Science Team Meeting 31 August – 2 September 2015, KNMI, de Bilt
Monitoring volcanic haze from space: the Bárðarbunga fissure eruption [Bárðarbungaaka Holuhraun !!!] Jos de Laat (KNMI) Sophie Smits (TU Delft, M.Sc) Martin de Graaf (TU Delft/ KNMI)
Factsheet Bárðarbunga- Late August 2014 to early March 2015- Fissure eruption, fairly constant lava flow rate- 1.6 ± 0.3 km3 of lava produced, 5-11 Mt SO2 [Gíslason et al., 2015]- Strength 5-10% of Laki 1783 (= ~ 100 Mt SO2, ~ 15 km3 of lava) [Stevenson et al., 2003; Gíslason et al., 2015] - Air quality standards on Iceland frequently exceeded - Occasional transport towards western Europe- Few problems with air quality in western Europe and Scandinavia
What made Bárðarbunga special?- many recent eruptions with lots of SO22006 Soufrière Hills (Montserrat, Caribic)2008 Kasatochi (Alaska, Aleutian Islands) ------------2009 Sarychev (Kamtjatska, Kuril Islands)2010 Eyjafjallajokull (Iceland)2010 Merapi (Indonesia)2011 Grimsvotn (Iceland)2011 Nabro (Ethiopia)2011 PuyeHue Cordon-Caulle (Chile)- all explosive eruptions, free tropospheric SO2- Bardarbunga: to our knowledge the first time satellite history eruption of this combined type, strength and duration.This type = fairly constant surface emissions, long duration of eruption
Bárðarbunga impact- formation of volcanic haze (“vog”)- SO2 transformed into sulfuric acid (H2SO4) - damaging to plants, affects the respiratory system in animals and humans.- Laki 1783: thousands of deaths on Iceland, failed crops- many more casualties throughout Europe, either directly or due to crop failure, famines or climatic effects (coldness)
Bárðarbunga: observing VOG formation [1]Research Questions:- Can we observe particle formation from SO2 with satellites?- Is there a relation between SO2 and aerosols?- What are the complexities of satellite observations of SO2 and aerosols? clouds, strong winds & fast transport, time difference MODIS & OMI observations- Is there added value in monitoring aerosols for such an eruption?
Bárðarbungaeruption, SO2and aerosol formation 24 September 2014 1 October 2014 Large image: MODIS AOT (NASA), insert: OMI SO2 (TEMIS KNMI/BIRA)
Bárðarbunga: observing VOG formation [2]Method:- Analyze OMI SO2 and MODIS AOT- similar spatial resolution (OMI 13×24 km2 vs MODIS 10×10 km2)- good coverage of Iceland region (multiple scenes per day from OMI)- OMI OMSO2 boundary layer SO2 product- MODIS AOT and MODIS AOT Fine Mode Fraction (FMF) (OCEAN ONLY !!!)- all days in September and October (not later due to Polar winter)
Example: 5 September 2014- enhanced AOT- high value MODIS FMF (Small Ratio)- aerosols from SO2 are expected to be small Complications: OMI row anomaly enhanced non-SO2 AOT elsewhere clouds
Analysis- 61 days to check- 14 days (26 cases) of either AOT or SO2- 12 cases with low AOT , little SO2- 7 cases with high AOT , little SO2- 3 cases with low AOT , high SO2- 4 cases with high AOT , high SO2Explanations:- time difference & plume displacement- other aerosols sources
Plume displacement thingy … 2 September 2014 case: • no correlation SO2 & AOT • time difference 41 min • fresh plume • small change wind direction Colors indicate distance from volcano (blueish < 500 km, redish > 500 km) Estimated OMI SO2 uncertainty 5 DU
Cases: the good, the bad, the ugly … REMOVE ALL SO2 MEASUREMENTS < 5 DU
The golden case (5 Sep 2014) … • good correlation (R2 = 0.46) • R2 = 0.61 for distances up to 650 km (blueish) • R2 = 0.68 for distances beyond 650 km (redish) • Plume aging, dispersion: SO2 ꜛ, AOD ꜜ ???
Summary- compared OMI SO2 and MODIS AOT for Bárðarbunga eruption Sep-Oct 2014 - reduced number of useful cases due to clouds, OMI row anomaly- even fewer useful cases due to plume displacement (obs. times differ)Conclusions- clear evidence of enhanced AOT due to conversion SO2 into particles- one golden case: good correlation between AOT and SO2- some evidence for plume aging effects (lifetimes, dispersion, chemistry ??)- there is added value in monitoring AOT for such eruptions (despite complications of collocating SO2 and AOT measurements) cloudy region, any information is welcome …paper in preparation: de Laat et al. 2015