Download
1 / 57
570 likes | 807 Vues
A comparative study of socio-economic disparities in preterm birth. Gry Poulsen – March 2012. Program for session. Presentation of participants Background for study Design of study – included cohorts Gestational age Socio-economic and demographic data Summary: Analysis plan.

E N D
A comparative study of socio-economic disparities in preterm birth Gry Poulsen – March 2012
Program for session Presentation of participants Background for study Design of study – included cohorts Gestational age Socio-economic and demographic data Summary: Analysis plan
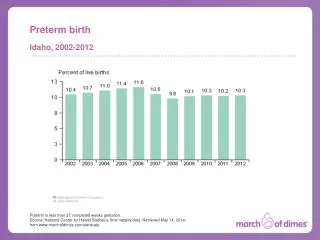
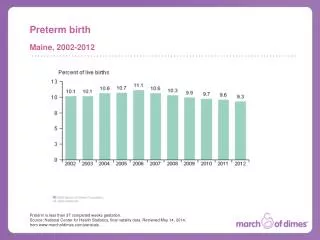
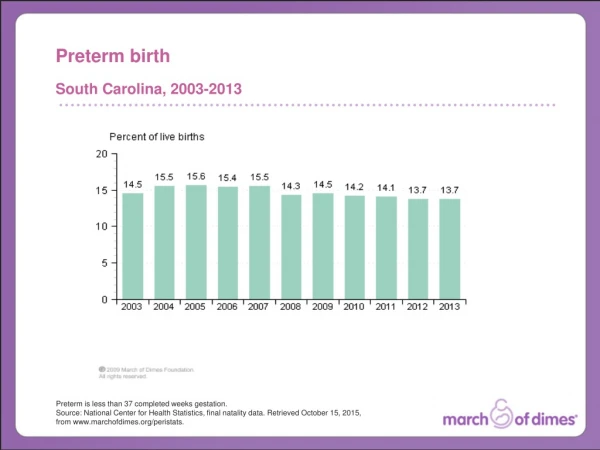
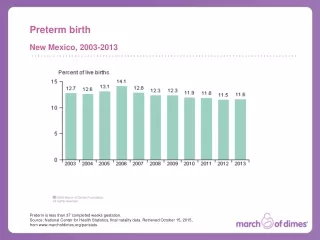
Preterm birth • Definition: Birth before 37 completed weeks gestation • Complicated to measure: • Maternal report of LMP • Ultra sound scans • Assessment at birth • Heterogeneous - multiple different underlying causes • Both an event and a marker for underlying conditions • Preterm birth rate depend on clinical practice
Socio-economic disparities in preterm birth <32 weeks 32-36 weeks Petersen et al; PPE 2008: 23, 66–75: Socio-economic inequality in preterm birth: a comparative study of the Nordic countries from 1981 to 2000 – data for the period 1996-2000
Why does this matter? Lindström et al; Pediatrics 2007;120;70-77: Preterm Infants as Young Adults: A Swedish National Cohort Study
How do we explain these differences? • Differences in use of antenatal care • Life style: smoking, overweight. • Work conditions: hard physical labour, standing up. • Psychosocial factors: stress, depression • Race or ethnic minorities • Infertility treatment • Unwanted pregnancies
Existing studies of mediators Morgen 2008 IJE (Danish National Birth Cohort): Smoking explained some of the educational gradient, but selected behavioural risk factors only reduced educational gradient marginally. Jansen 2009 Arch Dis Child Fetal Neonatal (Generation R): Educational gradient is largely explained by pregnancy characteristics, psychosocial well-being, and lifestyle habits. Niedhammer 2011 Eur J Pub Health (Lifeways cohort): Material factors reduced gradient by 1/3. Less reduction by behaviour.
Study 1: Comparative study • Aim: A comparative study looking at the association between socio-economic position and risk of preterm birth. • Separate analyses of data from each cohort- not data pooling. • Compare by characteristics of countries and cohorts • National policies, e.g. iatrogenic deliveries • National characteristics, e.g. economics • Interpretation of socio-economic markers • Cohort design differences, e.g. participation
Study 2: Mediating factors in risk of preterm birth Aim: To examine to which extent life style factors mediate social-economic disparities in preterm birth Data: 2-4 birth cohorts with rich data on life style factors and where a socio-economic gradient in risk of preterm birth has been found. Methods: Casusal methods based on a counterfactual approach as described by e.g. VanderWeele & Vansteelandt AJE 2010
Eligibility criteria for birth cohorts • Recruitement either during pregnancies or at birth of child • At least 3000 pregnancies/births recruited in study • Sampling irrespective of pregnancy complications and outcome. Exceptions: • Cohorts restricted to singleton pregnancies • Cohorts restricted to naturally conceived pregnancies
Identification of birth cohorts • Cohort inventories: • http://birthcohorts.net/ • http://www.birthcohortsenrieco.net/ • http://www.cls.ioe.ac.uk/ (international zone) • Other sources: cohort profiles, cohort home pages. • Results: • 66 cohorts identified • 19 eligible cohorts contacted • 12 participating cohorts
Participating cohorts • Aarhus birth cohort (DK, N=93,000) • ABCD (NL, N=7,863) • BiB (UK, N=13,000) • CCC 2000 (DK, N=6,090) • DNBC (DK, N~100,000) • Generation R (NL, N=9,778) • INMA (E, N=3,944) • MoBA (N, N=107,000) • NINFEA (I, N=3000) • PÉLAGIE (F, N=3,421) • PIAMA (NL, N=4,146) • SNiP (D, N=4,783)
Preliminary results Disclaimer: • The following tables are preliminary results and are not double-checked. • All results are computed for the analysis sample: liveborn singletons with non-missing GA ≥ 22 weeks and BW ≥ 500 grams. • Tables of available variables are based on the received data sets.
To discuss: • Entry at varying time point during pregnancy or at birth • Source and quality of reported gestational age • Whether to perform any data cleaning by comparing birth weight by gestational age to other references
Timing of recruitment • Entry at a time point during pregnancy: • Aarhus BC, ABCD, BiB, DNBC, Generation R, INMA, MoBa, NiNFEA, PIAMA, PELAGIE • Entry at birth: • CCC 2000, SNiP
Problems with recruitment during pregnancy • Preterm birth may occur before study entry • A woman must be at risk for PTB to contribute to analyses • If a large fraction of a cohort are recruited after 36 completed weeks, results may be biased as this group could not, by definition, get the outcome.
Problems with recruitment at birth • It may be more difficult to recruit women with very complicated deliveries and sick infants in intensive neonatal care. • Introduce risk of recall bias.
Solutions: • Survival analysis with delayed entry (time of recruitment) and censoring at 37 weeks. • Logistic regression with restriction of analysis sample to women recruited before 37 weeks.
Source and quality of gestational age For most cohorts, more than one GA measure is available. Mostly, one based on LMP and others based either on US or clinical assessment at birth. If more than one source of gestational age, which should we use? Choose LMP as this available in most cohorts, or go with best available measurement in each cohort?
Quality of gestational age • Source of gestational age • If more than one source of gestational age, which should we use? • Has any cleaning of gestational age and birth weight been performed? (e.g. Exclusion of very large or very small birth weight for gestational age?)
Proposed data cleaning • Exclude most extreme combinations from analyses • Use external reference based on clinical judgement, e.g. Alexander 1996, to identify implausible values • Use conservative measure in order only to identify the most extreme observations.
Aim: • To present the available data on socio-economic and demographic variables. • Discuss advantages and limitations in using the different variables. • Get feedback from cohorts on interpretation of variables.
Socio-economic and demographic variables • Coresocio-economic variables • Education • Occupation-basedsocio-economic position • Income • Labourmarket status • Otherdemographic variables: • Marital status/ co-habitation • Ethnicgroup
Interpretation of SEP indicators in relation to preterm birth Maternal education shows the strongest gradient with preterm birth (Morgen 2008, Parker 1994) Marital status only predictor in countries where single motherhood was uncommon (Zeitlin 2002)
Problems when combining data on socio-economic variables • Incomparabledefintions: e.g. income (relative to pricelevels and taxes), education (dependsoneducationstructure). • Context-specific interpretation: • Different sources: In some cohorts obtained through questionnaires, in other through register data. • Studies relying on register-data: DNBC and CCC2000 – need access to servers on Statistics Denmark to obtain information on SEP variables.
Education • Advantages: • Available in all cohorts • Goodquality of self-rapport • Limitations: • Reported in groupsthataredifficult to compare. • Primary and secondaryschool do not mean the same in differentcountries.
Levels of education * NINFEA has also recorded education as number of years
Suggested grouping 3 groups representing: • Short education (mandatory level, primary or lower secondary school) • Intermediate education (secondary school, vocational training) • Long education (universit degree, other further education)
Occupation-based socio-economic position • Advantages: • Goodmeasurewithwell-established interpretation • Limitations: • Onlyavailable in somecohorts and manydifferentcoding systems used. • Complex to compute • May bemisguiding for ”stay-at-home” mothers.
Labour market status • Advantages: • Relatively uncomplicated indicator • Easy to obtain through self-report • Disadvantage: • For some cohorts, only whether in paid work or not. Others have more finely divided groups, e.g. students, disability retirement. • Unemployed mothers may be unemployed by choice, be on leave or be unable to get a job. • Interpretation wiill be context-specific, depending on whether the mother lives in an area where stay at home with children is normal.
Marital status and co-habitation • Advantages: • Eithermarital status orco-habition is available in all cohorts. • Limitations: • In somecohortscohabitationvslivingalone, in othercohorts, legal marital status. • Relativelyfewwomenare single duringpregnancy
Ethnicity / birth • Advantages: • Ethnicgroupor country of birth is available to all • Limitations: • Immigrant and ethnicminority populations verydifferent in each country • Interpretation maybe relative to country of origin, culturalsubgroup and duration of stay in new country.