Download
1 / 33
330 likes | 440 Vues
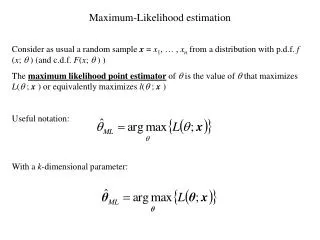
Non-Detects and Maximum Likelihood Estimation. USDA PDP Quality Assurance/Technical Meeting March 21, 2007 Arlington, VA Philip Villanueva Office of Pesticide Programs Health Effects Division. Outline. Importance of Censored Data How HED Handles <LOD Data MLE and <LOD Values

E N D
Non-Detects and Maximum Likelihood Estimation USDA PDP Quality Assurance/Technical Meeting March 21, 2007 Arlington, VA Philip Villanueva Office of Pesticide Programs Health Effects Division
Outline • Importance of Censored Data • How HED Handles <LOD Data • MLE and <LOD Values • Case Study Example • Demo
Data on incidents of thermal stress to O-rings were analyzed prior to the Challenger shuttle launch Flights with no incidence of thermal stress were not included in the original analysis The importance of this censored data was not recognized Importance of Censored Data
A simple plot of the proportion of flights with thermal distress including censored data By including the censored data, it easily seen that incidents of thermal distress to O-rings increases with lower temperatures Importance of Censored Data
Censored Data are Important to Risk Assessment • Typically >80-90% of PDP data is censored (less than the limit of detection, <LOD) • For risk assessment, it is important to distinguish between true zeroes and non-zero residues that are <LOD • Sensitivity analyses are performed to determine to what extent assumptions about the values of these non-zero <LODs have on the outcome of the risk assessment
Untreated Portion of Crop • For many crop-pesticide combinations, the residues are non-detectable (<LOD) • PDP reports <LODs as zeroes in the data base (by convention) • Some <LODs represent “true zeroes” where the crop is not treated with the pesticide of interest • Others represent non-zero concentrations below the analytical method’s LOD
How HED Handles <LOD Values • National percent crop treated (PCT) estimates are used to determine what portion of the crop are “true zeroes” Non-detectable Residues “True zeroes” (not treated) 0 < Concentration < LOD (treated)
Non-Quantifiable Residues • Some residues can be reliably detected, but not reliably quantified • These non-quantifiable concentrations are between the LOD and the limit of quantitation (LOQ) • PDP reports <LOQs as ½ LOQ in the database (by convention)
Percent Crop Treated Example 30% CT but only 10% >LOD …
Percent Crop Treated Example 30% CT but only 10% >LOD … “true zero” ½ LOQ ½ LOD
Parameter Estimation for Censored Data • Calculations of means and standard deviations will be influenced by the values selected for the <LODs and <LOQs • Substitution methods that replace <LODs with ½LOD (or <LOQs with ½ LOQ) can significantly bias estimates • Maximum likelihood estimation (MLE) based techniques provide better estimates
MLE Methods • MLE can be used to estimate parameters for left-censored data (such as <LODs) as well as interval-censored data (such as <LOQs) • MLE requires that a distributional form be specified • Frequently, PDP residue data can be reasonably approximated by a lognormal distribution (as can many other environmental data)
MLE Methods • MLE methods select a probability density function which maximizes the likelihood of observing the collected data • MLE estimates will be the most consistent with the observed sample data (both actual measurements and <LOD or <LOQ data) • Reflect the “most likely” set of parameters given the data actually observed
MLE Example • Probability density function (e.g., the bell curve) is “positioned” so as to maximize: ∑ log (histogram height x corresponding probability density) • This is maximized when large histogram bar height is matched with high probability density (i.e., when “fit” is best)
For example, consider a situation where 10% of the measurements are <LOD -- with <LOD measurements assumed to be present at ½ LOD All <LOD measurements assumed to be at ½ LOD 16
MLE Example • The curve is fitted such that both: 1) 10% of the area lies to the left of the LOD AND 2) the parameters that describe the curve are “optimized” to maximize the sum of the logs of the products of the histogram height and the corresponding probability density
.6 .4 Relative Probability (probability density function) .2 0 0 2 4 6 8 10 Poor Fit Poor Fit Much less than 10% of area under pdf is <LOD of 3.8 18
.6 .4 Relative Probability (probability density function) .2 0 0 2 4 6 8 10 Better Fit …but less than 10% of area under pdf is <LOD of 3.8 19
.6 .4 ~10% of area under pdf is <LOD of 3.8 Best Fit Relative Probability (probability density function) .2 ~10% 0 0 2 4 6 8 10 20
Case Study Example From: Aggregate Exposure Assessment International Risk Science Institute Workshop Report International Life Sciences Institute (ILSI) http://rsi.ilsi.org/NR/rdonlyres/913BD903-4ECE-42B2-AF3C-FE80EE391A85/0/rsiaggexp.pdf
<0.1 <0.1 <0.1 0.1334 0.2088 0.2947 0.3490 0.4600 <0.5 <0.5 <0.5 <0.5 <0.5 <0.5 <0.5 0.5829 0.7106 0.8355 1.629 2.365 Case Study Example
Indicates whether a value is entered at the LOD or is a “real” measurement
The expected z-score of the percentile associated with the residue value where: Z = F-1(p)
The log-likelihood value for each residue …
The log-likelihood value for each residue … ...and the sum of the log-likelihood values which is maximized by Excel’s Solver
The “fill-in” values for BLOD which are associated with the maximized log-likelihood
Conclusions • Censored concentration data (<LOD and <LOQ) values comprise the majority of residues in OPP risk assessment and are important to appropriately consider • OPP has developed guidance and standard procedures for incorporating this data into its risk assessments • Sensitivity analyses
Conclusions • Maximum Likelihood Estimation (MLE) methods represent the “state of the art” in statistical methods for properly accounting for censored data • As OPP risk assessments become more refined, we anticipate greater use of MLE methods • OPP has developed an MLE spreadsheet in Excel that can be used to easily perform MLE procedures