Download
1 / 30
320 likes | 444 Vues
Financial Forecasting Projection Modeling and Dashboard Dials. Financial Management. There are 3 components to managing the finances in a business. Profitability Modeling. This presentation will focus on the components that assist a business with maximizing and managing PROFIT …….

E N D
Financial ForecastingProjection Modeling and Dashboard Dials
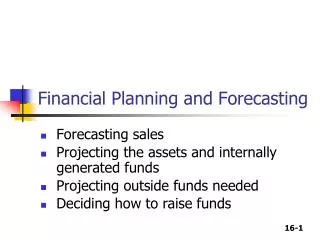
Financial Management There are 3 components to managing the finances in a business Profitability Modeling This presentation will focus on the components that assist a business with maximizing and managing PROFIT……. Cash Flow Management Capital Management
OUTPUTS A 15 page HEALTH CHECK outlining the financial well being of your business, together with key metrics and ratios A monthly Projection Model that details the financial effect of every aspect of your business A management DASHBOARD of the key metrics and indicators customized for your business Click on this symbol at any time to return to this screen
Profitability Modeling Cash Flow Management Capital Management Click on these symbols at any time to see each component
We start by entering P&L and Balance sheet information that is easily obtained from your existing system and/or your CPA 3-5 years information is preferred, but not essential The software also accepts outputs from common packages, like Quickbooks Health Check
Health Check • Depending on the quality of the information there may be a requirement to clarify aspects of the data with you or your CPA, either by telephone or face to face meeting. • The report is delivered in a 2 hour presentation, generally 1-2 weeks after we have received all the information
Health Check A comprehensive, 15 page financial diagnostic of your business outlining the financial performance against key metrics and detailing trends that have affected (or will affect) profitability
We start with completed HEALTH CHECK report OR by entering P&L and Balance sheet information that is easily obtained from your existing system and/or your CPA 3-5 years information is preferred, but not essential The software also accepts outputs from common packages, like Quickbooks Projection Model
Once the historical information is entered in, a click of the “Strategy” button….. Projection Model
This profit is low…..by typing in a desired figure (say 5%), the software shows us what will need to change to make this happen
..and this is their relative sensitivity These are the components that will impact the change
You can also see reports from year to year…. or month to month
Including the Balance Sheet items…. It’s what the bank is interested in
The final outcome is a month by month “playbook” to achieve the desired financial goals completed for your business
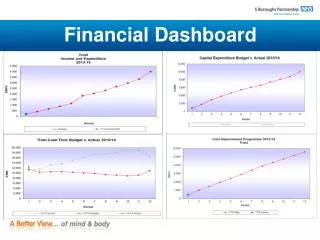
Why a Dashboard? • This tool works like a spreadsheet – change an input NUMBER (like price or number of units to be sold) and the outcome NUMBER (like profit or expense) changes • ….but it works by moving a SLIDER and seeing the impact on a DIAL… Green is good, Red is not… easy isn’t it?
What’s involved? • If an organization has completed a HEALTH CHECK or PROJECTION MODEL, our standard process is one or twomeetings with our specialist team member/s to develop the Metrics and Outputs (color of dials, your logo etc). • In all other instances, the number of sessions and/or meetings will depend on the quality of information provided
What do I get ? • The Company Wide Metrics – a global view plus the components that affect your overall profit
What do I get ? • Profit by Department (or Location) – see how each location contributes to the overall business
What do I get ? • Each Department or location– view the actuals and key metrics for each location or department
How much? • The pricing is modular and consists of 3 components • A Financial Report and Health Check of your business outlining the key drivers that are affecting your PROFITABILITY (P&L) and BANKABILITY (Balance Sheet) • Projection Modeling – a forecasting tool that keeps you and your management team headed toward the business financial goals and reports how you are doing MONTHLY • The Dashboard Dials – the graphical display of your numbers by Company, Department or Product Line and any of the key metrics you choose to monitor
How much? • Financial Report and Health Check • $3,500 • Data Gathering, Normalization, Analysis • Report covers many aspects such as Key Trends, Working Capital Cycle, Balance Sheet Drivers, Cash Flow etc • Monthly Forecasting and Projection Tool • $3,250 - $7,250 ** • Annual Forecast broken down Monthly by Department / Location / Product Line • Revenue, Cost of Goods, Cost of Sales, General & Admin, Cash Flow metrics • Dashboard Dials • Set Up fee $1,750 - $5,250 ** • Dials update fee $120/month - $350/month ** • Company Wide and by Department/Location/Product Line • Specific metrics for each Department/Location/Product Line ** based on number of Departments/Locations/Product Lines and/or number of Dials
How much? We can also assist you with; Cash Flow (Forecasting and managing cash flow) • By quotation • Capital Management (Including Debt restructuring, Line of Credit increase, SBA, Bank relationship arrangement and/or change, Private Equity, Merger, Acquisition, Trade Sale) • Success Fee based
How do I proceed? • Talk to your CPA and ask if they are a Swiss Avenue Partners preferred customer • Email: Linas@SwissAvenuePartners.com • Or Telephone an office; • Sacramento, CA – (916) 934 0626 • San Diego, CA – (760) 277 7446 • Silicon Valley, CA – (415) 694 0507 • Austin, Tx – (512) 970 0711 Click here to go to our web site and find more information under Profitability Modeling Like to see this presentation again?