Download

1 / 33
380 likes | 713 Vues
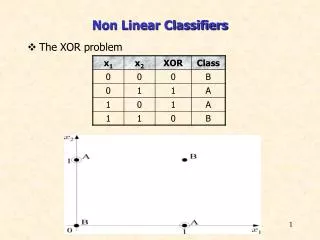
Linear Classifiers. Dept. Computer Science & Engineering, Shanghai Jiao Tong University. Outline. Linear Regression Linear and Quadratic Discriminant Functions Reduced Rank Linear Discriminant Analysis Logistic Regression Separating Hyperplanes. Linear Regression.

E N D
Linear Classifiers Dept. Computer Science & Engineering, Shanghai Jiao Tong University
Outline • Linear Regression • Linear and Quadratic Discriminant Functions • Reduced Rank Linear Discriminant Analysis • Logistic Regression • Separating Hyperplanes Linear Classifiers
Linear Regression • The response classes is coded by a indicator variable. A K classes depend on K indicator variables, as Y(k), k=1,2,…, K, each indicate a class. And N train instances of the indicator vector could form a indicator response matrix Y. • To the Data set X(k), there is map: X : X(k) Y(k) • According to the linear regression model: f(x)=(1,XT)B^ Y ^=X(XTX)-1XTY Linear Classifiers
Linear Regression • Given X, the classification should be: • In another form, a target tk is constructed for each class, the tk presents the kth column of a K identity matrix, according to the a sum-of-squared-norm criterion : and the classification is: Linear Classifiers
Problems of the linear regression • The data come from three classes in IR2 and easily separated by linear decision boundaries. • The left plot shows the boundaries found by linear regression of indicator response variables. • The middle class is completely masked . The rug plot at bottom indicates the positions and the class membership of each observations. The 3 curves are the fitted regressions to the 3-class indicator variables. Linear Classifiers
Problems of the linear regression • The left plot shows the boundaries found by linear discriminant analysis. And the right shows the fitted regressions to the 3-class indicator variables. Linear Classifiers
Linear Discriminant Analysis • According to the Bayes optimal classification mentioned in chapter 2, the posteriors is needed. post probability : assume: ——condition-density of X in class G=k. ——prior probability of class k, with Bayes theorem give us the discriminant: Linear Classifiers
Linear Discriminant Analysis • Multivariate Gaussian density: • Comparing two classes k and l , assume Linear Classifiers
Linear Discriminant Analysis • The linear log-odds function above implies that the class k and l is linearin x; in p dimension a hyperplane. • Linear Discriminant Function: So we estimate Linear Classifiers
Parameter Estimation Linear Classifiers
LDA Rule Linear Classifiers
Linear Discriminant Analysis • Three Gaussian distribution with the same covariance and different means. The Bayes boundaries are shown on the left (solid lines). On the right is the fitted LDA boundaries on a sample of 30 drawn from each Gaussian distribution. Linear Classifiers
Quadratic Discriminant Analysis • When the covariance are different • This is the Quadratic Discriminant Function • The decision boundary is described by a quadratic equation Linear Classifiers
LDA & QDA • Boundaries on a 3-classes problem found by both the linear discriminant analysis in the original 2-dimensional space X1, X2 (the left) and in a 5-dimensional space X1, X2, X12, X12, X22 (the right). Linear Classifiers
LDA & QDA • Boundaries on the 3-classes problem found by LDA in the 5-dimensional space above (the left) and by Quadratic Discriminant Analysis (the right). Linear Classifiers
Regularized Discriminant Ana. • Shrink the separate covariances of QDA toward a common covariance as in LDA. Regularized QDA • was allowed to be shrunk toward the scalar covariance. Regularized LDA • Together : Linear Classifiers
Regularized Discriminant Ana. • Could use • In recent micro expression work, we can use where in a “SHRUNKEN CENTROID” Linear Classifiers
Test and training errors for the vowel data, using regularized discriminant analysis with a series of values of . The optimum for the test data occurs around , close to quadratic discriminant analysis Linear Classifiers
Computations for LDA • The eigen-decomposition for each where is orthonormal, and is a diagonal matrix of positive eigenvalues . • So the ingredients for are: Linear Classifiers
Reduced Rank LDA • Let • Let • LDA: • Closest centroid in sphered space( apart from ) • Can project data onto K-1 dim subspace spanned by , and lose nothing! • Can project even lower dim using principal components of , k=1, …, K. Linear Classifiers
Reduced Rank LDA • Compute matrix M of centroids • Compute • Compute B*, cov matrix of M* , and • is l-th discriminant variable ( canonical variable ) Linear Classifiers
A two-dimensional plot of the vowel training data. There are eleven classes with ,and this is the best view in terms of a LDA model. The heavy circles are the projected mean vectors for each class. Linear Classifiers
Projections onto different pairs of canonical varieties Linear Classifiers
Reduced Rank LDA • Although the line joining the centroids defines the direction of greatest centroid spread, the projected data overlap because of the covariance ( left panel). • The discriminant direction minimizes this overlap for Gaussian data ( right panel). Linear Classifiers
Fisher’s problem • Find “between-class var” is maximized relative to “within-class var”. • Maximize “Rayleigh quotient” : Linear Classifiers
Training and test error rates for the vowel data, as a function of the dimension of the discriminant subspace. • In this case the best rate is for dimension 2. Linear Classifiers
South African Heart Disease Data Linear Classifiers
Logistic Regression • Model: Linear Classifiers
Logistic Regression / LDA Same form as Logistic Regression Conditional Likelihood Probability Linear Classifiers
Rosenblatt’s Perceptron Learning Algorithm • --distance of points in M to boundary • Stochastic Gradient Descent Linear Classifiers
A toy example with two classes separable by hyperplane. The orange line is the least squares solution, which misclassifies one of the training points. Also shown are two blue separating hyperplanes found by the perceptron learning algorithm with different random starts. Separating Hyperplanes Linear Classifiers
Optimal Separating Hyperplanes Linear Classifiers