Download
1 / 27
270 likes | 384 Vues
Achieving the 2050 Greenhouse Gas Reduction Goal How Far Can We Reach with Energy Efficiency?. Arthur H. Rosenfeld, Commissioner California Energy Commission (916) 654-4930 ARosenfe@Energy.State.CA.US http://www.energy.ca.gov/commission/commissioners/rosenfeld.html

E N D
Achieving the 2050 Greenhouse Gas Reduction GoalHow Far Can We Reach with Energy Efficiency? Arthur H. Rosenfeld, Commissioner California Energy Commission (916) 654-4930 ARosenfe@Energy.State.CA.US http://www.energy.ca.gov/commission/commissioners/rosenfeld.html or just Google “Art Rosenfeld”
Introduction • Focus will be on 2030 as my crystal ball is hazy after that • Will the world find motivation to reduce CO2? • Hurricanes (more frequent, further North), Fall fires and droughts • The UN or a “super-G8” must cooperate in this effort • With financial incentives for China, India, … for “clean” coal. • Cap and Trade systems will probably not be sufficient to keep levels at 450 ppm or below • To modify behavior (e.g. land use, travel) switch to a Carbon Tax where you can tax “bads” to pay for “goods” (e.g. social security or medical insurance) • ~$3/gallon of gasoline, ~$300/ton of CO2, or ~20 cents/kWh • “Free Trade” for lower carbon fuels. e.g • Elimination of $0.50 per gallon on imported ethanol
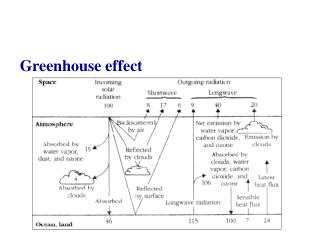
To maintain 50/50 chance of staying below 2°C implies stabilizing <450ppm GtCO2e (at least 30 Gt reduction by 2030) Possible emission trajectories 2000-2100 of global Emissions: from Hal Harvey, “Design to Win,” California Environmental Associates, adapted from Stern Review http://www.climateactionproject.com/docs/Design_to_Win_8_01_07.pdf
Available interventions in 6 sectors Worldwide could secure 5/6 of target based on Design to Win 25 GtCO2e 17 In Other Sectors* ~60 20 Emissions 6 Mitigation potential 14 Target >30 Unknown mitigation 9 ~5 4 3 12 “Known” mitigation ~25 2030 BAU emissions Power* Industry Buildings Transport Forestry Agriculture/ waste/ other 2030 mitigation potential * Power sector emissions (but not mitigation potential) counted in industry and building sectors 070604 dtw summary
Conservation Supply Curves Explained • Start with conservation supply curves for electricity, natural gas, gasoline, etc • Annual benefit = yearly saved bills – annualized cost of measure • Then convert kWh or therms or gallons or … to CO2 avoided • Note that shaded areas are dollars saved or spent (depending if below or above the x-axis) See NAS “Policy Implications of Greenhouse Warming” 1992, App. B • Policy Implications of Greenhouse Warming: Mitigation, Adaptation, and the Science Base (1992) Committee on Science, Engineering, and Public Policy (COSEPUP ...books.nap.edu/books/0309043867/html
McKinsey Quarterly http://www.mckinseyquarterly.com/Energy_Resources_Materials/ A_cost_curve_for_greenhouse_gas_reduction_abstract
8% 17% 25% 33% 42% 50% 58%
Turning to California • AB 32 CO2 Goals: • 1990 levels by 2020 • 80% below 1990 levels by 2050 • Where are we headed? Note: CO2 historic and projected data continue to change, consider these as estimates
Cool Urban Surfaces and Global Warming Hashem Akbari Heat Island Group Lawrence Berkeley National Laboratory Tel: 510-486-4287 Email: H_Akbari@LBL.gov http:HeatIsland.LBL.gov PALENC Conference, September 27, 2007; Crete, Greece
Acknowledgement • Co-authors • Dr. Arthur H. Rosenfeld, Commissioner, California Energy Commission • Dr. Surabi Menon, Staff Scientist, Lawrence Berkeley National Laboratory Research was funded by the Public Interest Energy Research (PIER) Program, California Energy Commission.
Cool Roof Technologies New Old flat, white pitched, cool & colored pitched, white
Cool Surfaces also Cool the Globe Cool roof standards are designed to reduce a/c demand, save money, and save emissions. In Los Angeles they will eventually save ~$100,000 per hour. But higher albedo surfaces (roofs and pavements) directly cool the world, quite independent of avoided CO2. So we discuss the effect of cool surfaces for tropical, temperate cities.
100 Largest Cities have 670 M People Mexico CityNew York CityMumbaiSão Paulo Tokyo
Radiative Forcing (RF) of 1 tCO2. • Myhre et al. (1998), for well mixed CO2, quote RF [W/m2]= 5.35 ln(1+ ΔC/C). Inserting ΔC = 1 t CO2, we find RF(worldwide) ~ 1kW. so, enough white roof to reflect 1 kW (on average, night, day, adjusted for clouds) will offset 1 ton of CO2. “Enough” turns out to be 30 m2. So each 200 m2 white roof offsets ~7 t CO2.
Dense Urban Areas are 1% of Land Area of the Earth = 508x1012 m2 Land Area (29%) = 147x1012 m2 [3] Area of the 100 largest cities = 0.38x10¹² m2 = 0.26% of Land Area for 670 M people Assuming 3B live in urban area, urban areas = [3000/670] x 0.26% = 1.2% of land But smaller cities have lower population density, hence, urban areas = 2% of land = 3x10¹² m2 [4] Dense, developed urban areas only 1% of land [5]
Potentials to Increase Urban Albedo is 0.1 Typical urban area is 25% [6] roof and 35% [7] paved surfaces Roof albedo can increase by 0.25 for a net change of 0.25x0.25=0.063 Paved surfaces albedo can increase by 0.15 for a net change of 0.35x0.15=0.052 Net urban area albedo change at least 0.10
Effect of Increasing Urban Albedo by 0.1 Roof area = 0.25 [6]*1.5x1012 m2 [5] = 3.8x10¹¹ m2 [8] Carbon reduction of cool roofs= 33 kg CO2/m2 [1]* 3.8x1011 m2 [8] = 12 GT CO2 [9] Paved area = 0.35 [7]*1.5x1012 m2 [5] = 5.3x10¹¹ m2 [10] Carbon reduction of cool pavement= 20 kg CO2/m2 [2]*3.8x1011 m2 [10] = 7.5 GT CO2 [11] Carbon reduction of cool roofs and cool pavements= 20 GT CO2 [12] 20 GT CO2 is half of the annual world emission of 40 GT CO2eq --- a reprieve of 6 mo with NO emissions.
Cooler cities as a mirror Mirror Area = 1.5x10¹² m2 [5] *(0.1/0.7)[δ albedo of cities/ δ albedo of mirror]= 0.2x10¹² m2 {This is equivalent to an square of 460 km on the side}
Equivalent Value of Avoided CO2 CO2 currently trade at ~$25/ton 20 GT worth $500 billion, for changing albedo of roofs and paved surface Cooler roofs alone worth $300B Cooler roofs also save air conditioning (and provide comfort) worth five times $300B Let developed countries offer $1 million per large city in a developing country, to trigger a cool roof/pavement program in that city
Effect of Increasing Urban Albedo by 0.1 on Global Temperature is -0.01K Using Harte’s equations (Consider a Spherical Cow, pages 166, 174), the change in air temperature in lowest 1.8 km = 0.011K Using Hansen et al. (1997), the change in air temperature is = 0.016K (checks Harte’s) 26
References 27 Hansen et al. 1997: J Geophys Res, 102, D6(6831-6864) Myhre et al. 1998: Geophys Res Let, 25, 14(2715-2718) Harte 1988: Consider a Spherical Cow, pages 166, 174