Download
1 / 12
120 likes | 216 Vues
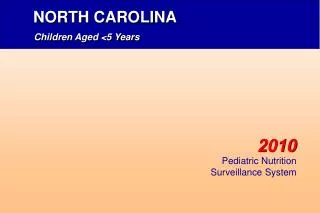
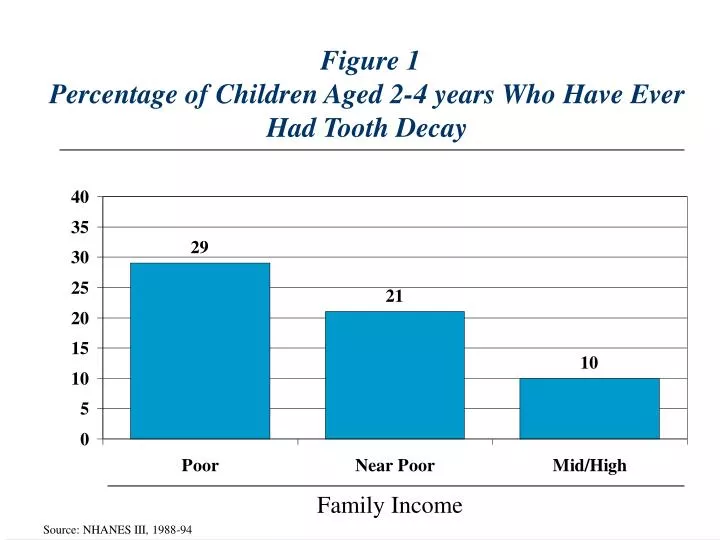
Figure 1 Percentage of Children Aged 2-4 years Who Have Ever Had Tooth Decay. Family Income. Source: NHANES III, 1988-94. Figure 2 Percentage of Children Age 15 Who Have Untreated Tooth Decay. Level of Education (Head of Household). H.S.: High-school level of education.

E N D
Figure 1Percentage of Children Aged 2-4 years Who Have Ever Had Tooth Decay Family Income Source: NHANES III, 1988-94
Figure 2Percentage of Children Age 15 Who Have Untreated Tooth Decay Level of Education (Head of Household) H.S.: High-school level of education Source: NHANES III, 1988-94
Figure 3Percentage of Children with at Least One Dental Sealant Family Income Level of Education Age 8 Age 14 H.S.: High-school Source: NHANES III, 1988-94
Figure 4Percentage of Children with a Preventive Dental Visit* in past year by Age and Family Income * includes prophylaxis, fluorides, or sealants Source: Medical Expenditure Panel Survey, 1996
Figure 5Percentage of Children, age 0-18, with a Preventive Dental Visit* in past year by Race/Ethnicity and Family Income * includes prophylaxis, fluorides, or sealants Source: Medical Expenditure Panel Survey, 1996
Figure 6Percentage of Adults aged 35-44 Years with Tooth Decay Race/Ethnicity Source: NHANES III, 1988-94
Figure 7Percentage of Adults age 65+ With Complete Tooth Loss Level of Education H.S.: High-school level of education Source: NHIS, 1997
Figure 8Total Tooth Loss, Age 65+: 1995-1998 20% 21-25.9% HP 2000 Objective: 20% 26-34.9% 35% Source: BRFSS 1995-1998 Data unavailable
Figure 9Percentage of Adults Age 35-44 With Destructive Periodontal Disease Family Income Source: NHANES III, 1988-94
Figure 10Oral Cancer Mortality Rate Ages 45-74, by Gender and Race* * per 100,000 Source: Vital Statistics, 1997
Figure 11Percentage of Adults, Age 35+ Who Reported a Past Year Dental Visit Level of Education H.S.: High-school level of education Source: NHIS 1997
Figure 12Dental Visits in Past Year, Age 35+: 1995-1998 70% 65-69.9% HP 2000 Objective: 70% <65% Data unavailable Source: BRFSS 1995-1998