Download
1 / 24
240 likes | 351 Vues
National Forest Resources Monitoring and Assessment (NAFORMA) and REDD. By R.E. Malimbwi & E. Zahabu Sokoine University of Agriculture. BACKGROUND. The National Forestry Resources Monitoring and Assessment (NAFORMA) Tanzania Implemented by FBD Supported by Finnish Govt thru FAO

E N D
National Forest Resources Monitoring and Assessment (NAFORMA)and REDD By R.E. Malimbwi & E. Zahabu Sokoine University of Agriculture
BACKGROUND The National Forestry Resources Monitoring and Assessment (NAFORMA) Tanzania • Implemented by FBD • Supported by Finnish Govt thru FAO Goals • to provide forest resource related information for domestic use as well as the international reporting requirements • to establish a long-term monitoring system of the forestry ecosystems on timely and regular basis. • to take into consideration the emerging need to improve REDD readiness
Specific objectives • Establish at the national level a broad consensus on the approach to NAFORMA in Tanzania • Strengthen capability of FBD to collect, analyze and update the needed information on forests and trees • Prepare a national map based on harmonized forest classification and other land uses • Undertake a national forestry resource assessment and develop national database. • Design specific and management oriented inventory in priority areas and formulate projects • Prepare a proposal on integration of data needs for REDD monitoring thru NARFORMA
CURRENT NAFORMA STATUS Currently NAFORMA is in its inception phase which has emphasis on: i) Mapping and analyzing of the information needs in cooperation with stakeholders • This forms a basis for the detailed inventory design • It has impact on costs and approach • It will improve effectiveness of results to wider audience • ii) Inventory design which will result in • Providing information needed by stakeholders • Integration of REDD into NAFORMA
METHODOLOGY The methodology used to reach the current status was: • literature search • stakeholders’ interviews • Stakeholders’ workshop
Findings • Previous forest inventories
Findings • Previous remote sensing/mapping related projects and initiatives in Tanzania
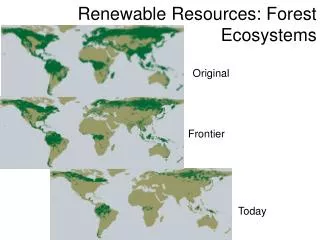
2000 1992 1975 1992 2000 1975 2006 2006 Forest cover change in East Usambara between 1975-2006ca16,680 ha lost! By J. Hall
NAFORMA Stakeholders • Embassies: Norway, Finland, • Ministries: MNRT (Forestry& Wildlife), Agriculture, Environment, PRALOG, Lands, Livestock, Water, Planning, • Private Organizations: InfoBridge • NGOs: TFCG, WWF, WCST, CARE • Research Institutions: TAFORI, SUA, IRA • Government Agencies: TTSA, Eastern Arc, TMA, Tanzania Bureau of Statistics (TBS) • Key individuals: Acting Coordinator NFA, REDD focal point, FBD Survey Section, Commissioner for Land use Planning (Ministry of Lands), Director of Land Use Planning (Ministry of Agric)
Stakeholders information needs • Extent of forest resources in Tanzania by categories of: • vegetation type (species in plantations & natural forests) • ownership (e.g size of reserved forests and forests in general land) • stocking levels including carbon estimates • use status (productive/protective e.g catchment & wetlands areas) • Biodiversity status • Location of seed sources of important tree species. • Deforestation and degradation levels, • Trees outside the Forest area (TOF) • Non wood Forest Products • Harvestable volume
Stakeholders’ information needs cont. • The Directorate of Land Use Planning • Extent of potential agricultural area in the general land, private and village land • Extent of current rangeland • The Forest and Beekeeping Division wants to know the location, content, growth rate and generally extent of its forest resources in Tanzania.
Methodological Review Land use land cover classification Use the broader land use categories as in Global FRA (2005) classification i.e Forest, Other wooded land, Other land and Inland water. Separate broader categories into smaller classes • Forest : Miombo, Montane, Mangroves, Coastal, Plantations • Other woodland: Wooded grasslands, shrub, scrub, thickets • Other land: barren, grassland, annual crop, perennial crop, pastures, urban, mining site etc • Inland water: Lakes, rivers, Dam, The forest may further be sub-divided into stocking level (carbon densities) such as intact, degraded and much degraded. Separate the broader classes according to ownership: Central government FR, Local government FR, private FR, PFM (JFM and CBFM), National parks, Nature Reserves, Game Reserves, General land • The total area resulting from 1, 2 and 3 must be equal
Sampling Design • Reliability of estimates • Efficient use of resources • Time • Equipment • Personnel • Money
Implementation • Stratified systematic sampling adopted • The entire country area is divided into strata • Strata will be composed on the basis of administrative districts and vegetation types • Measurement unit • a cluster of field plots • number of the plots per cluster is 6-10 • the number plots per stratum will depend on the forest variability • higher in forest than in non forested areas
Implementation cont • Establishment of sampling intensities • Need a small study using existing data • Determine precision requirements and hence sampling intensities • Take measurements in concentric plots • Within 2 m radius: all trees with dbh ≥ 1 cm will be recorded • within 5 m radius; all trees with dbh 5 cm will be recorded • within 10 m radius; all trees with dbh 10 cm will be recorded • within 15 m radius; all trees with dbh 20 cm will be recorded
Implementation cont • Record other variables according to stakeholders needs
Integration with REDD • A key aspect of determining the carbon benefit of any forest carbon project is to accurately quantify the levels of carbon changes to known levels of precision • The main focus is to determine the net differences of carbon stocks in the different pools over a specified time period • At a national level this requires among other things good quality data from detailed continuous forest inventory of individual forests based on known forest variability • The proposed inventory will facilitate the estimation of at most Tier 2 emission factors
Integration of REDD cont • It is envisaged that Tier 3 forest data will be generated by forest projects during the REDD piloting phase • Projects may use some of NAFORMA plots • One third to half of the measured NAFORMA plots should be permanent sample plots • The proposed criteria of choosing permanent sample plots are: • threatened/degraded area • undegraded/undisturbed areas and, • plots with vulnerable species
RESEARCH OPPORTUNITIES LiDAR • Payments for carbon credits hinges on effective monitoring to estimate the reduced deforestation and forest degradation • This is challenging because it demands spatial as well as temporal data with high resolution • Using communities is an option but has spatial limitation • Remote sensing (images, i.e., aerial photographs, satellite imageries), can provide high spatial and temporal resolution at a reasonable cost • But • Poor accuracy in estimating biomass and carbon stocks • Can hardly be used to detect forest degradation
SOLUTION • Remote sensing that captures 3-Dimensions of the forest • RADAR-radio waives • LiDAR (Light Detection And Range) • RADAR saturates at 200 tons/ha • LiDAR has no saturation point ie can be used in any forest • Some forests in Tanzania have >700 cu m/ha (Chome, Amani) • LiDAR operated on board aircrafts is already operational for biomass assessment
LiDAR • Tested and proved effective in temperate forests over the past 10-15 years but not in tropical forests • SUA and Norwegian University of Life Sciences are developing a research project to; • Test LiDAR capability of estimating biomass in different vegetation types in Tanzania • Enhance Capacity building, Ph.D. training, and technology transfer • NAFORMA will provide the ground thruthing data • LiDAR paths will be chosen to benefit from the NAFORMA field sample plots
The End! Thank You