Download
1 / 45
590 likes | 854 Vues
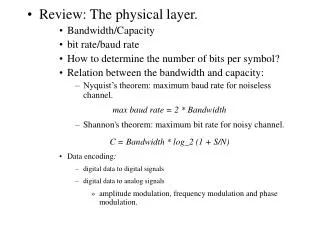
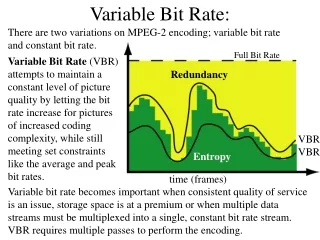
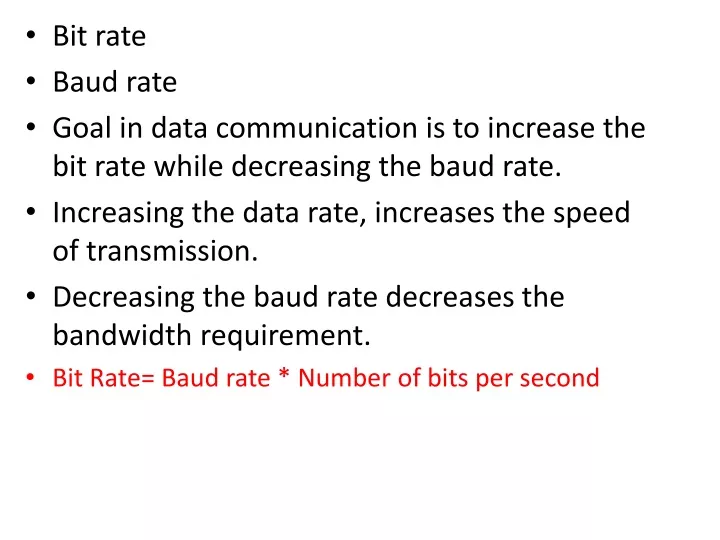
Bit rate Baud rate Goal in data communication is to increase the bit rate while decreasing the baud rate. Increasing the data rate, increases the speed of transmission. Decreasing the baud rate decreases the bandwidth requirement. Bit Rate= Baud rate * Number of bits per second. Figure 5-1.

E N D
Bit rate • Baud rate • Goal in data communication is to increase the bit rate while decreasing the baud rate. • Increasing the data rate, increases the speed of transmission. • Decreasing the baud rate decreases the bandwidth requirement. • Bit Rate= Baud rate * Number of bits per second
Figure 5-1 Different Conversion Schemes
Figure 5-2 Digital to Digital Encoding
Figure 5-3 Types of Digital to Digital Encoding
Figure 5-4 Unipolar Encoding
Figure 5-5 Types of Polar Encoding
Polar schemes • The voltages are on both side of the time axis. • NRZ (non return to zero) • NRZ-L : The level of the voltage determines the value of bit. • NRZ-I : the change in the level of the voltage determines the level of the bit. If there is no change, the bit is 0, if there is a change, the bit is 1.
Figure 5-6 NRZ-L and NRZ-I Encoding
when the voltage level in a digital signal is constant for a while, the spectrum creates very low frequencies. These frequencies around zero, called DC components, present problems for a short system that cannot pass low frequencies.
Return to zero • It uses three values: positive, negative and zero. • The signal changes not between bits but during the bit. The signal goes to zero in the middle of each bit. • The main disadvantage is that it requires two signal changes to encode a bit and therefore occupies greater bandwidth. • Another problem is its complexity.
Figure 5-7 RZ Encoding
Figure 5-8 Manchester and Diff. Manchester Encoding
Manchester encoding : the duration of bits is divided into two halves. The voltage remains at one level during the first half and moves to the other level in the second bit. • A negative to positive transition represents binary 1 and a positive to negative transition represents binary 0.
Digital to Analog Conversion • Digital data needs to be carried on an analog signal. • A carrier signal (frequency fc) performs the function of transporting the digital data in an analog waveform. • The analog carrier signal is manipulated to uniquely identify the digital data being carried.
Amplitude Shift Keying (ASK)orON-OFF Keying (OOK) • ASK is implemented by changing the amplitude of a carrier signal to reflect amplitude levels in the digital signal. • For example: a digital “1” could not affect the signal, whereas a digital “0” would, by making it zero.
Figure 5.3 Binary amplitude shift keying BW= (fc-Nbaud/2)+(fc-Nbaud/2) BW=(1+d) * Nbaud Note: Minimum value of d=0 (factor related to the modulation process)
Frequency Shift Keying • The digital data stream changes the frequency of the carrier signal, fc. • For example, a “1” could be represented by f1=fc +f, and a “0” could be represented by f2=fc-f.
Figure 5.6 Binary frequency shift keying BW= (fc1-fc0)+Nbaud
Phase Shift Keyeing • We vary the phase shift of the carrier signal to represent digital data. • PSK is much more robust than ASK as it is not that vulnerable to noise, which changes amplitude of the signal.
Figure 5.9 Binary phase shift keying BW= (fc-Nbaud/2)+(fc-Nbaud/2) BW=(1+d) * Nbaud Note: Minimum value of d=0 (factor related to the modulation process)
Quadrature PSK • To increase the bit rate, we can code 2 or more bits onto one signal element. • In QPSK, we parallelize the bit stream so that every two incoming bits are split up and PSK a carrier frequency. One carrier frequency is phase shifted 90o from the other - in quadrature. • The two PSKed signals are then added to produce one of 4 signal elements. L = 4 here.
Note Quadrature amplitude modulation is a combination of ASK and PSK.
Figure 8-1 Multiplexing vs. No Multiplexing The McGraw-Hill Companies, Inc., 1998 WCB/McGraw-Hill
Figure 8-3 FDM The McGraw-Hill Companies, Inc., 1998 WCB/McGraw-Hill
Figure 8-4 FDM, Time Domain The McGraw-Hill Companies, Inc., 1998 WCB/McGraw-Hill
Figure 8-6 Demultiplexing, Time Domain The McGraw-Hill Companies, Inc., 1998 WCB/McGraw-Hill
Five channels, each with a l00-kHz bandwidth, are to be multiplexed together. What is the minimum bandwidth of the link if there is a need for a guard band of 10kHz between the channels to prevent interference?
WDM • WDM is conceptually the same as FDM, except that the multiplexing and de-multiplexing involve optical signals transmitted through fiber-optic channels. • The idea is the same: We are combining different signals of different frequencies. • Although WDM technology is very complex, the basic idea is very simple. • We want to combine multiple light sources into one single light at the multiplexer and do the reverse at the de-multiplexer. The combining and splitting of light sources are easily handled by a prism.
Figure 8-8 TDM The McGraw-Hill Companies, Inc., 1998 WCB/McGraw-Hill
Figure 8-9 Synchronous TDM The McGraw-Hill Companies, Inc., 1998 WCB/McGraw-Hill
Figure 8-10 TDM, Multiplexing The McGraw-Hill Companies, Inc., 1998 WCB/McGraw-Hill
Figure 8-11 TDM, Demultiplexing The McGraw-Hill Companies, Inc., 1998 WCB/McGraw-Hill
Interleaving • TDM can be visualized as two fast-rotating switches, one on the multiplexing side and the other on the de-multiplexing side. • The switches are synchronized and rotate at the same speed, but in opposite directions. • On the multiplexing side, as the switch opens in front of a connection, that connection has the opportunity to send a unit onto the path. This process is called interleaving. • On the de-multiplexing side, as the switch opens in front of a connection, that connection has the opportunity to receive a unit from the path.
Figure 8-12 Framing Bits The McGraw-Hill Companies, Inc., 1998 WCB/McGraw-Hill
The addressing in its simplest form can be n bits to define N different output lines with n =10g2 N. • For example, for eight different output lines, we need a 3-bit address. • Since a slot carries both data and an address in statistical TDM, the ratio of the data size • to address size must be reasonable to make transmission efficient. For example, it • would be inefficient to send 1 bit per slot as data when the address is 3 bits. This would • mean an overhead of 300 percent. • In statistical TDM, the capacity of the link is normally less than the sum of the capacities of each channel.