Download
1 / 24
240 likes | 359 Vues
Modeling fMRI data generated by overlapping cognitive processes with unknown onsets using Hidden Process Models. Rebecca A. Hutchinson (1) Tom M. Mitchell (1,2) (1) Computer Science Department, Carnegie Mellon University (2) Machine Learning Department, Carnegie Mellon University

E N D
Modeling fMRI data generated by overlapping cognitive processeswith unknown onsets using Hidden Process Models Rebecca A. Hutchinson (1) Tom M. Mitchell (1,2) (1) Computer Science Department, Carnegie Mellon University (2) Machine Learning Department, Carnegie Mellon University Statistical Analyses of Neuronal Data (SAND4), May 30, 2008
Hidden Process Models • HPMs are a new probabilistic model for time series data. • HPMs are designed for data that is: • generated by a collection of latent processes that have overlapping spatial-temporal signatures. • high-dimensional, sparse, and noisy. • accompanied by limited prior knowledge about when the processes occur. • HPMs can simultaneously recover the start times and spatial-temporal signatures of the latent processes.
Process 1: Process P: d1 … dN d1 … dN t t Example … … … t t Prior knowledge: There are a total of 6 processes in this window of data. An instance of Process 1 begins in this window. An instance of Process P begins in this window. An instance of either Process 1 OR Process P begins in this window. d1 … dN
Simple Case: Known Timing Apply the General Linear Model: Y=XW D p1 p2 p3 D 1 0 0 0 0 0 0 0 0 0 1 0 1 0 0 1 0 0 0 0 1 0 1 0 0 1 0 0 0 0 0 0 1 0 0 1 … … … W(1) p1 = Y p2 W(2) T W(3) p3 Convolution Matrix X Unknown parameters W Data Y [Dale 1999]
Challenge: Unknown Timing D p1 p2 p3 D 1 0 0 0 0 0 0 0 0 0 1 0 1 0 0 1 0 0 0 0 1 0 1 0 0 1 0 0 0 0 0 0 1 0 0 1 … … … W(1) p1 = Y p2 W(2) T W(3) p3 Uncertainty about the processes essentially makes the convolution matrix a random variable.
fMRI Data … Hemodynamic Response Features: 10,000 voxels, imaged every second. Training examples: 10-40 trials (task repetitions). Signal Amplitude Neural activity Time (seconds)
Goals for fMRI • To track cognitive processes over time. • Estimate process hemodynamic responses. • Estimate process timings. • Allowing processes that do not directly correspond to the stimuli timing is a key contribution of HPMs! • To compare hypotheses of cognitive behavior.
Our Approach • Model of processes contains a probability distribution over when it occurs relative to a known event (called a timing landmark). • When predicting the underlying processes, use prior knowledge about timing to limit the hypothesis space.
Study: Pictures and Sentences Press Button View Picture Read Sentence • Task: Decide whether sentence describes picture correctly, indicate with button press. • 13 normal subjects, 40 trials per subject. • Sentences and pictures describe 3 symbols: *, +, and $, using ‘above’, ‘below’, ‘not above’, ‘not below’. • Images are acquired every 0.5 seconds. Read Sentence Fixation View Picture Rest t=0 4 sec. 8 sec. [Keller et al, 2001]
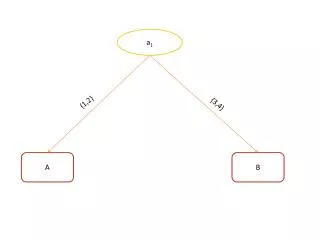
Process 1: ReadSentence Response signature W: Duration d: 11 sec. Offsets W: {0,1} P(): {q0,q1} Process 2: ViewPicture Response signature W: Duration d: 11 sec. Offsets W: {0,1} P(): {q0,q1} Processes of the HPM: v1 v2 v1 v2 Input stimulus : sentence picture Timing landmarks : Process instance:2 Process h: 2 Timing landmark: 2 Offset O: 1 (Start time: 2+ O) 1 2 One configuration c of process instances 1, 2, … k: (with prior fc) 1 2 Predicted mean: + N(0,s1) v1 v2 + N(0,s2)
HPM Formalism HPM = <H,C,F,S> H = <h1,…,hH>, a set of processes (e.g. ReadSentence) h = <W,d,W,Q>, a process W = response signature d = process duration W = allowable offsets Q = multinomial parameters over values in W C = <c1,…, cC>, a set of configurations c = <p1,…,pL>, a set of process instances • = <h,l,O>, a process instance (e.g. ReadSentence(S1)) h = process ID • = timing landmark (e.g. stimulus presentation of S1) O = offset (takes values in Wh) • = <f1,…,fC>, priors over C S = <s1,…,sV>, standard deviation for each voxel [Hutchinson et al, 2006]
Encoding Experiment Design Processes: Input stimulus : Constraints Encoded: h(p1) = {1,2} h(p2) = {1,2} h(p1) != h(p2) o(p1) = 0 o(p2) = 0 h(p3) = 3 o(p3) = {1,2} ReadSentence = 1 ViewPicture = 2 Timing landmarks : 1 2 Decide = 3 Configuration 1: Configuration 2: Configuration 3: Configuration 4:
Inference • Over configurations • Choose the most likely configuration, where: • C=configuration, Y=observed data, D=input stimuli, HPM=model
Learning • Parameters to learn: • Response signature W for each process • Timing distribution Q for each process • Standard deviation s for each voxel • Expectation-Maximization (EM) algorithm to estimate W and Q. • E step: estimate a probability distribution over configurations. • M step: update estimates of W (using reweighted least squares) and Q (using standard MLEs) based on the E step. • After convergence, use standard MLEs for s.
Uncertain Timings • Convolution matrix models several choices for each time point. Configurations for each row: P S D t=1 t=1 t=2 t=2 … t=18 t=18 t=18 t=18 … 3,4 1,2 3,4 1,2 … 3 4 1 2 … 1 0 0 0 0 0 0 0 0 0 0 0 1 0 0 0 0 0 0 1 0 0 0 0 0 0 0 0 0 0 0 1 0 0 0 0 … … … 0 0 1 0 0 0 0 1 0 0 0 1 0 0 0 0 0 1 0 0 0 0 0 1 0 1 0 0 0 0 0 0 1 0 0 1 ... … … T’>T
Uncertain Timings • Weight each row with probabilities from E-step. P S D Configurations: Weights: 3,4 1,2 3,4 1,2 … e1 e2 e3 e4 … 1 0 0 0 0 0 0 0 0 0 0 0 1 0 0 0 0 0 0 1 0 0 0 0 0 0 0 0 0 0 0 1 0 0 0 0 … … … Y = W e1 = P(C=3|Y,Wold,Qold,sold) + P(C=4|Y,Wold,Qold,sold)
Potential Processes Can group these many ways to form different HPMs
Comparing HPMS Participant Cross-validated data log-likelihood. All values are *106.
Are we learning the right number of processes? For each training set, the table shows the average (over 30 runs) test set log-likelihood of each of 3 HPMs (with 2, 3, and 4 processes) on each of 3 synthetic data sets (generated with 2, 3, and 4 processes). Each cell is reported as mean ± standard deviation. NOTE: All values in this table are *105.
Ongoing Research • Regularization for process response signatures (adding bias for temporal and/or spatial smoothness, spatial priors, spatial sparsity). • Modeling process response signatures with basis functions. • Allowing continuous start times (decoupling process starts from the data acquisition rate) • A Dynamic Bayes Net formulation of HPMs.
References • Dale, A.M., Optimal experiment design for event-related fMRI, 1999, Human Brain Mapping, 8, 109-114. • Hutchinson, R.A., Mitchell, T.M., & Rustandi, I., Hidden Process Models, 2006, Proceedings of the 23rd International Conference on Machine Learning, 433-440. • Keller, T.A., Just, M.A., & Stenger, V.A., Reading span and the time-course of cortical activation in sentence-picture verification, 2001, Annual Convention of the Psychonomic Society.