Download
1 / 16
160 likes | 422 Vues
Got Milk?. Sarah Selz. Grade 9. 2-27-02. Augusta High School. Table of Contents. Table of Contents. Experiment Continued 2. Skim Milk Graph. Introduction. Background Information. Conclusion. Data Analysis. Whole Milk Graph. Ingredients. References. Experiment. 2% Milk Graph. End.

E N D
Got Milk? Sarah Selz Grade 9 2-27-02 Augusta High School Table of Contents
Table of Contents Experiment Continued 2 Skim Milk Graph Introduction Background Information Conclusion Data Analysis Whole Milk Graph Ingredients References Experiment 2% Milk Graph End ExperimentContinued 1% Milk Graph
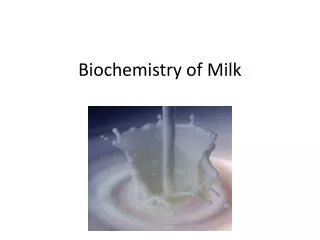
INTRODUCTION • My experiment is taking four different kinds of milk and adding one drop of vegetable oil and three drops food coloring to the top. Then, I just recorded my data. • I got the idea for my project from the Internet. • I hypothesized that milk that contained more fat would create swirls that with less fat. • I chose this experiment because it would be an interesting thing to find out.
Background Information Before the experiment I collected the information I needed to do the experiment. During the experiment I read a summary of what was supposed to happen according to someone else. After the experiment I read the labels of all the things that I used to find out the ingredients. To see them, click here.
Ingredients 2% Milk: Reduced fat milk Vitamin D3 Vitamin A Palmitate 1% Milk Low fat milk Vitamin D3 Vitamin A Palmitate Whole Milk: Milk Vitamin D3 Red Food Coloring: Propylene Glysol FD&C Red 41 Vegetable Oil: Canola Oil Soybean Oil Skim Milk Non-fat milk Vitamin D3 Vitamin A Palmitate
EXPERIMENT Materials: 6.) Vegetable Oil 7.) 1/4 teaspoon 8.) 4 glasses of equal size 9.) Notebook and pencil 10.) clock/timer Materials: 1.) Whole Milk 2.) 2% Milk 3.) 1% Milk 4.) Skim Milk 5.) Food Coloring
E x p e r i m e n t Step-by-Step Procedure 1.) Get out all of your materials so they are ready to use. 2.) Line up your four glasses 3.) Pour one cup of each milk type into its own glass. 4.) Add 3 of food coloring and 1/4 tsp. vegetable oil to the milk about one cm away from each other. 5.) Make sure you remember which glass is which. 6.) Now, record every 5 minutes and at 1/2 and 1 hour.
Experiment Independent Variable: the milk type Dependent Variable: the amount of swirls Constants: air temperature, amount of food coloring, amount of vegetable oil, amount of milk, size of glass, time in glass Control: a plain glass of milk Trial Numbers: three Data type: qualitative
Data Analysis • I basically got the results that I expected. • So, my hypothesis was pretty much right. • If I were to do it again, however, I would make a better hypothesis that used more theories or values. • Also, I would broaden the area of research.
WHOLE Swirls (on scale of 1-10) 1 2 3 4 5 6 7 8 9 10 0 5 10 15 20 25 30 35 40 45 50 55 60 Time (in minutes)
Two % ) 1 2 3 4 5 6 7 8 9 10 Swirls (on scale of 1-10) 0 5 10 15 20 25 30 35 40 45 50 55 60 Time (in minutes)
One % 1 2 3 4 5 6 7 8 9 10 Swirls (on scale of 1-10) 0 5 10 15 20 25 30 35 40 45 50 55 60 Time (in minutes)
Skim 1 2 3 4 5 6 7 8 9 10 Swirls (on scale of 1-10) 0 5 10 15 20 25 30 35 40 45 50 55 60 Time (in minutes)
Conclusion Here is a summary of my results. First, I got my idea off of the Internet. Then, I made a hypothesis that milk with the most fat would have the most swirls. After my hypothesis, I researched and found my background information. Next, I conducted my experiment. The results were as follows: 1.) Whole and 2% tied for the most swirls. 2.) 1% came in next. 3.) Skim came in last.
References Http://www.science/projects/lob.ideas~milk.htm http://www.excite/projects/science/milk~food/colouring.edu. I also checked the labels of my materials. They were listed in my background information.