Download
1 / 12
120 likes | 215 Vues
Human Geography – Population. 12/8 to 12/12. Writing systems of the world. Population growth. Birthrate: number of lives births per 1,000 people 2000 – Nigeria – 54 2000 – Latvia – 8 Average is 22

E N D
Human Geography – Population 12/8 to 12/12
Population growth • Birthrate: number of lives births per 1,000 people • 2000 – Nigeria – 54 • 2000 – Latvia – 8 • Average is 22 • Fertility Rate: average number of children a woman in child bearing years would have in a life time. • 2.1 is necessary to maintain same population • Current average is 3
Population Growth • Mortality Rate: (death rate) number of deaths per thousand people • Healthy/wealthy countries have low mortality rate • However, some healthy/wealthy countries have high number because large number of elderly. • Infant Mortality Rate: number of infant deaths under age 1 per 1,000 births • 1800 – 200 to 300 • Current – 110
Population in the middle east • Use Page 484-484 to answer the following questions….. This is from 2000 • 1. What is the life expectancy Kuwait? • 2. What is the birthrate and the infant mortality rate in Kuwait? • 3. Which country in the Middle East has the longest life expectancy? • 4. Which country in the Middle East has the highest infant mortality rate? Which has the lowest?
Population pyramid – Page 79 • Sex and Age distribution of a population • Why is there certain ages where there is a significantly larger population?
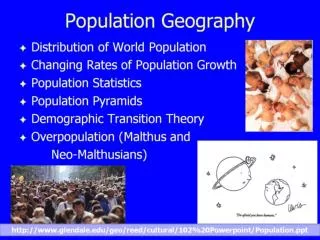
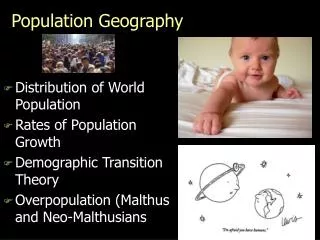
Population distribution • 90% of world’s population lives in the Northern Hemisphere • 50% of the population live in East Asia or South Asia. • 66% of the worlds population lives between 20 N and 60 N. • Push-Pull Factors: Reasons to Migrate • Factors determining where people live… • Climate • Altitude • Access to water/resources
Population density • Average number of people who live in a measurable area, such as a square mile. • Kuwait: 153.58/sq. km (3) • U.S.: 54.65/sq. km (1) • Tokyo: 6,029/sq. km (120) • Monaco: 16,205/sq. km (324) • Carrying Capacity: number of organisms a piece of land can support.
Japan • http://www.youtube.com/watch?v=9XfVl6_R7_k