Download

1 / 5
50 likes | 257 Vues
Get free intraday tips in Nifty Future,Nifty spot, Bank Nifty and in Equity daily. Get updates about financial news from US, Europe, Asia and China daily. Get free 2-3 stock or stock future or stock option suggestion daily. Also get 2-3 stock daily which is in news with trend.

E N D
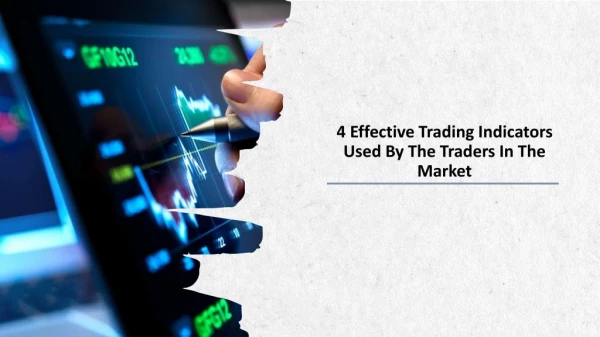
In stock market most important point is entry point, exit point and market trend. Market trend gives you the bullish or bearish trend. Perfect entry and exit point gives you the profit. So to know the market trend and entry, exit point you have to follow some technical indicators. In Indian market there are lots of indicators but four most effective trading indicators are generally used. • Candlestick Pattern • Moving Averages • MACD • Stochastic
Candlestick Pattern Candlestick pattern is a movement in prices shown graphically on a candlestick chart. It is one of the oldest and Best Indicators for Intraday Trading still in used.If the closing price is above the opening price, then a green candle is formed which is called bullish candlestick. If closing price is below the opening price then a red candle is formed which is called bearish candlestick.
Moving averages In below image the first section is called candle stick pattern. Blue and red color line is called long moving average and short moving average line respectively. Best Equity Intraday Trading Strategy can be made with moving averages. When short moving average cross long moving average (near cross over in image) then market moves up and is called golden cross and When short moving average cross long moving average in downward direction market moves down.
MACD Second section is MACD-moving average convergence and divergence. It shows buy and sell volume. Stochastic Third section is called stochastic. Below 30 is the oversold region and above 70 is overbought region.If stochastic line crosses above 30 in upward movement, then bullish market takes place. When stochastic line cross 70, it reaches over bought zone and profit booking takes place and stochastic line move downward.