Download
1 / 50
540 likes | 818 Vues
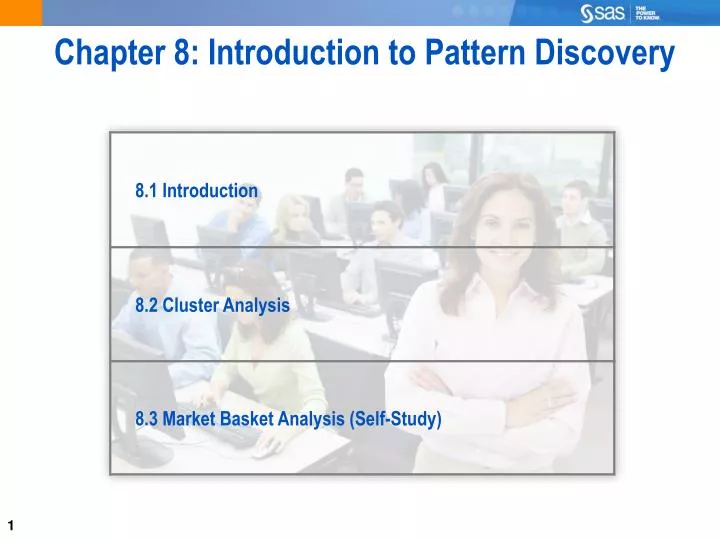
Chapter 8: Introduction to Pattern Discovery. Chapter 8: Introduction to Pattern Discovery. Pattern Discovery. The Essence of Data Mining? “…the discovery of interesting, unexpected, or valuable structures in large data sets.” – David Hand. Pattern Discovery. The Essence of Data Mining?

E N D
Pattern Discovery The Essence of Data Mining? “…the discovery of interesting, unexpected, or valuable structures in large data sets.” – David Hand ...
Pattern Discovery The Essence of Data Mining? “…the discovery of interesting, unexpected, or valuable structures in large data sets.” – David Hand “If you’ve got terabytes of data, and you’re relying on data mining to find interesting things in there for you, you’ve lost before you’ve even begun.” – Herb Edelstein
Pattern Discovery Caution • Poor data quality • Opportunity • Interventions • Separability • Obviousness • Non-stationarity
Pattern Discovery Applications Data reduction Novelty detection Profiling Market basket analysis Sequence analysis C A B ...
Pattern Discovery Tools Data reduction Novelty detection Profiling Market basket analysis Sequence analysis C A B ...
Pattern Discovery Tools Data reduction Novelty detection Profiling Market basket analysis Sequence analysis C A B
Unsupervised Classification cluster 1 Unsupervised classification: grouping of cases based on similarities in input values. cluster 2 cluster 3 cluster 1 cluster 2 inputs grouping ...
Unsupervised Classification cluster 1 Unsupervised classification: grouping of cases based on similarities in input values. cluster 2 cluster 3 cluster 1 cluster 2 inputs grouping ...
k-means Clustering Algorithm Training Data 1. Select inputs. 2. Select k cluster centers. 3. Assign cases to closest center. 4. Update cluster centers. 5. Re-assign cases. 6. Repeat steps 4 and 5 until convergence.
k-means Clustering Algorithm Training Data 1. Select inputs. 2. Select k cluster centers. 3. Assign cases to closest center. 4. Update cluster centers. 5. Re-assign cases. 6. Repeat steps 4 and 5 until convergence.
k-means Clustering Algorithm Training Data 1. Select inputs. 2. Select k cluster centers. 3. Assign cases to closest center. 4. Update cluster centers. 5. Reassign cases. 6. Repeat steps 4 and 5 until convergence. ...
k-means Clustering Algorithm Training Data 1. Select inputs. 2. Select k cluster centers. 3. Assign cases to closest center. 4. Update cluster centers. 5. Reassign cases. 6. Repeat steps 4 and 5 until convergence. ...
k-means Clustering Algorithm Training Data 1. Select inputs. 2. Select k cluster centers. 3. Assign cases to closest center. 4. Update cluster centers. 5. Reassign cases. 6. Repeat steps 4 and 5 until convergence. ...
k-means Clustering Algorithm Training Data 1. Select inputs. 2. Select k cluster centers. 3. Assign cases to closest center. 4. Update cluster centers. 5. Reassign cases. 6. Repeat steps 4 and 5 until convergence. ...
k-means Clustering Algorithm Training Data 1. Select inputs. 2. Select k cluster centers. 3. Assign cases to closest center. 4. Update cluster centers. 5. Reassign cases. 6. Repeat steps 4 and 5 until convergence. ...
k-means Clustering Algorithm Training Data 1. Select inputs. 2. Select k cluster centers. 3. Assign cases to closest center. 4. Update cluster centers. 5. Reassign cases. 6. Repeat steps 4 and 5 until convergence. ...
k-means Clustering Algorithm Training Data 1. Select inputs. 2. Select k cluster centers. 3. Assign cases to closest center. 4. Update cluster centers. 5. Reassign cases. 6. Repeat steps 4 and 5 until convergence. ...
k-means Clustering Algorithm Training Data 1. Select inputs. 2. Select k cluster centers. 3. Assign cases to closest center. 4. Update cluster centers. 5. Reassign cases. 6. Repeat steps 4 and 5 until convergence. ...
k-means Clustering Algorithm Training Data 1. Select inputs. 2. Select k cluster centers. 3. Assign cases to closest center. 4. Update cluster centers. 5. Reassign cases. 6. Repeat steps 4 and 5 until convergence. ...
k-means Clustering Algorithm Training Data 1. Select inputs. 2. Select k cluster centers. 3. Assign cases to closest center. 4. Update cluster centers. 5. Reassign cases. 6. Repeat steps 4 and 5 until convergence. ...
k-means Clustering Algorithm Training Data 1. Select inputs. 2. Select k cluster centers. 3. Assign cases to closest center. 4. Update cluster centers. 5. Reassign cases. 6. Repeat steps 4 and 5 until convergence. ...
k-means Clustering Algorithm Training Data 1. Select inputs. 2. Select k cluster centers. 3. Assign cases to closest center. 4. Update cluster centers. 5. Reassign cases. 6. Repeat steps 4 and 5 until convergence. ...
k-means Clustering Algorithm Training Data 1. Select inputs. 2. Select k cluster centers. 3. Assign cases to closest center. 4. Update cluster centers. 5. Reassign cases. 6. Repeat steps 4 and 5 until convergence. ...
Segmentation Analysis Training Data When no clusters exist, use the k-means algorithm to partition cases into contiguous groups.
8.01 Multiple Choice Poll • For a k-means clustering analysis, which of the following statements is true about input variables? • Input variables should be limited in number and be relatively independent. • Input variables should be of interval measurement level. • Input variables should have distributions that are somewhat symmetric. • Input variables should be meaningful to analysis objectives. • All of the above.
8.01 Multiple Choice Poll – Correct Answer • For a k-means clustering analysis, which of the following statements is true about input variables? • Input variables should be limited in number and be relatively independent. • Input variables should be of interval measurement level. • Input variables should have distributions that are somewhat symmetric. • Input variables should be meaningful to analysis objectives. • All of the above.
Demographic Segmentation Demonstration Analysis goal: Group geographic regions into segments based on: income, household size, and population density. Analysis plan: • Select and transform segmentation inputs. • Select the number of segments to create. • Create segments with the Cluster tool. • Interpret the segments.
Segmenting Census Data This demonstration introduces SAS Enterprise Miner tools and techniques for cluster and segmentation analysis.
Exploring and Filtering Analysis Data This demonstration introduces SAS Enterprise Miner tools and techniques that explore and filteranalysis data, particularly data source exploration and case filtering.
Setting Cluster Tool Options This demonstration illustrates how to use the Cluster tool to segment the cases in the CENSUS2000 data set.
Creating Clusters with the Cluster Tool This demonstration illustrates how the Cluster tool determines the number of clusters in the data.
Specifying the Segment Count This demonstration illustrates how you can change the number of clusters created by the Cluster node.
Exploring Segments This demonstration illustrates how to use graphical aids to explore the segments.
Profiling Segments This demonstration illustrates using the Segment Profile tool to interpret the composition of clusters.
Exercises This exercise reinforces the concepts discussed previously.
Market Basket Analysis A A B A B B C C C D C D D E E Rule A D C A A C B & C D Support 2/5 2/5 2/5 1/5 Confidence 2/3 2/4 2/3 1/3 ...
Market Basket Analysis A A B A B B C C C D C D D E E Rule A D C A A C B & C D Support 2/5 2/5 2/5 1/5 Confidence 2/3 2/4 2/3 1/3 ...
Implication? Support(SVG CK) = 50% Confidence(SVG CK) = 83% Expected Confidence(SVG CK) = 85% Lift(SVG CK) = 0.83/0.85 < 1 Checking Account No Yes 3500 5000 1000 500 4,000 No Savings Account 6,000 Yes 10,000
Barbie Doll Candy Put them closer together in the store. Put them far apart in the store. Package candy bars with the dolls. Package Barbie + candy + poorly selling item. Raise the price on one, and lower it on the other. Offer Barbie accessories for proofs of purchase. Do not advertise candy and Barbie together. Offer candies in the shape of a Barbie doll.
Data Capacity A A B A C D A A B A D B
Association Tool Demonstration Analysis goal: Explore associations between retail banking services used by customers. Analysis plan: • Create an association data source. • Run an association analysis. • Interpret the association rules. • Run a sequence analysis. • Interpret the sequence rules.
Market Basket Analysis This demonstration illustrates how to conduct market basket analysis.
Sequence Analysis This demonstration illustrates how to conduct a sequence analysis.
Exercise This exercise reinforces the concepts discussed previously.
Pattern Discovery Tools: Review Generate cluster models using automatic settings and segmentation models with user-defined settings. Compare within-segment distributions ofselected inputs to overall distributions. Thishelps you understand segment definition. Conduct market basket and sequence analysis on transactions data. A data source must have one target, one ID, and (if desired) one sequence variable in the data source.