Download
1 / 45
460 likes | 597 Vues
La façade atlantique et l’interface maritime / terrestre nord américaine. Jean-Paul Rodrigue Associate Professor, Dept. of Global Studies & Geography, Hofstra University, New York, USA. Éléments de l’Interface Maritime / Terrestre. Foreland (Shipping Network). Maritime Freight Distribution.

E N D
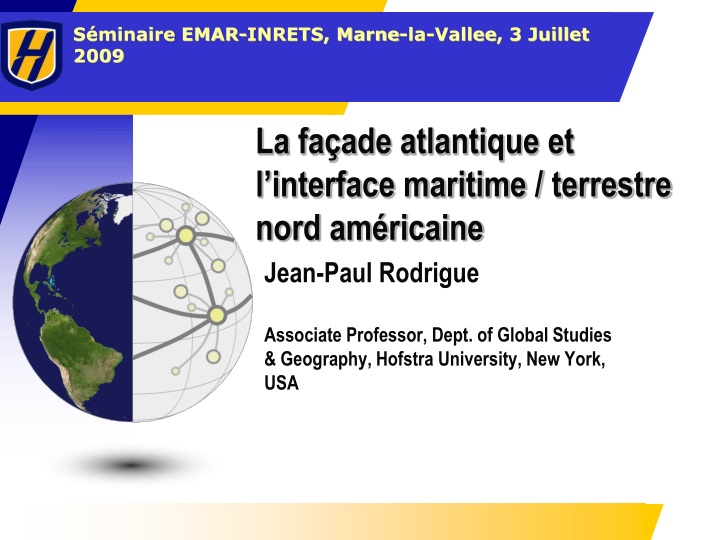
La façade atlantique et l’interface maritime / terrestre nord américaine Jean-Paul Rodrigue Associate Professor, Dept. of Global Studies & Geography, Hofstra University, New York, USA
Éléments de l’Interface Maritime / Terrestre Foreland (Shipping Network) Maritime Freight Distribution Port System Gateways Road Rail Coastal / Fluvial Inland FreightDistribution Corridors and Hubs Hinterland (FDC)
L’intégration des systèmes de transport • Transport maritime • Économies d’échelle. • Réseaux maritimes. • Terminaux portuaires. • Transport terrestre • Navettes ferroviaires et fluviales. • Terminaux intermodaux. • Ponts terrestres. • Logistique intermodale • Intégration des systèmes. • Ports intérieurs / zones logistiques.
Les flux de conteneurs sont en déséquilibres Million TEUs Growth (2000-2007) 15.4 (+175%) 14.9 4.9 (+48%) Asia 19.9 33.1 USA 10.0 (+178%) 7.6 17.7 (+293%) Imports (M TEUs) 4.5 (+55%) 20.4 Europe 14.5 2.7 (+23%) Exports (M TEUs)
La Cote Est de l’Amérique du Nord St. Laurent « L’entonnoir » et le goulot: Montréal Chaine Nord « L’évier vide » Faibles marges: Halifax et Boston Chaine Centrale « L’évier plein » Fortes marges: New York et Hampton Roads Chaine Sud « L’ évier en remplissage » Centre fort: Charleston / Savannah Chaine Nord ChaineSud ChaineCentrale St. Laurent
Le trafic de conteneurs de la cote est, 2007 4th Tier (Niche ports) 3rd Tier (Regional Gateways) Divergence Threshold 2nd Tier (Gateways) Articulation Gateway
Taux de croissanceannuelle des principaux ports de la cote est: De la convergence vers la divergence Divergence Convergence
Trafic de conteneurs par façade nord américaine, 1990-2008 et projections pour 2015
Trafic de conteneurs pour les principaux ports de la cote est, 1990-2008 et projections pour 2015
La desserte de la cote est nord américaine Singapore Colombo “China Effect” Hong Kong Shanghai Jeddah Pusan Kobe Eastbound Route Gioia Tauro Algeciras Seattle / Vancouver Westbound Route West Coast Congestion Landbridge Congestion LA/LB Growth in the Southeast New Distribution Gateways Landbridge PanamaRoute
Changements possibles des options de desserte de la cote est nord Américaine Zone of Contestability NY Savannah Equilibrium (indifference) Point Eastbound Route Westbound Route 3 New York (1): 75% (2005) 60% (2020) New York (2+3): 25% (2005) 40% (2020) 1 Landbridge 2 PanamaRoute
La dynamique « All Water Services » versus le trans-pacifique / pont terrestre Port congestion Offshore transshipment Transloading Unit train assembly Rail congestion Transmodal operations Road congestion Transpacific / Landbridge 18 days Port congestion Offshore transshipment Panama / Suez Delays All Water Services NY: 22 days Savannah: 21 days
Le problème du « Last Mile » demeure prépondérant Massification Atomization Frequency Capacity REGIONAL LOCAL HINTERLAND GLOBAL Shipping Network Segment Corridor Customer “Last Mile” Inland Terminal Distribution Center Gateway
Le rôle des terminaux de transports dans l’interface maritime / terrestre Port Terminals Barge terminal Container sea terminal Intermediate hub Rail Terminals Load center Transmodalterminal Satelliteterminal On-dock and near dock DistributionCenters Warehousing Cross-docking Transloading
Le système ferroviaire nord américain: des sous-systèmes en interaction
Rail Track Mileage and Number of Class I Rail Carriers, United States, 1830-2007
Operating Revenue of Major North American Railroads, 2007 (million U.S. dollars)
L’impact de la déréglementation sur la performance ferroviaire, 1964-2005
L’insertion des ports intérieurs en Amérique du Nord: une tripartie Corridor ferroviaire vers la porte d’entrée Terminal ferroviaire intermodal Port Intérieur Activités logistiques
ComplexeLogistique de Savannah North Point Real Estate Savannah River International Trade Park Ikea Target TEC Home Depot Wal-Mart Crossroads Industrial Park NS Near Dock Intermodal Terminal Port Industrial Park Container Terminals
CenterPoint-KCS Intermodal Center, Kansas City Phase 1 Kansas City (25 km) ► Phase 2 Retail Phase 4 Phase 3 KCS Intermodal Yard Phase 5
La valeur ajoutée est avant tout la recherche d’opportunités locales: Subtropolis, Kansas City
L’arriere-pays du port de Montréal Western Canada Quebec 3% 31% Ontario 10% 27% Atlantic 4% Northeast Midwest West Coast 2% 22% Southeast Gulf <1% Trucking <1% Rail
L’arrière-pays de Montréal: Une marge contestée • New York • 85% cargo regional • 14% par rail PIDN • Hampton Roads • 47% cargo regional • 53% par rail Rickenbacker HeartlandCorridor (2010) VIP Roanoke
Heartland Corridor Project, Virginia / Chicago Current Double Stack Route (1,264 miles to Chicago) Virginia Inland Port Heartland Corridor (1,031 miles to Chicago) 28 Tunnels Modified to a 20’ 3” Clearance
Virginia Inland Port NS Port Royal IntermodalTerminal Washington (100km) ►
Rickenbacker Global Logistics Park, Columbus Ohio Gateway Campus Columbus (15km)► North Campus Rail Campus Rickenbacker International Airport Air Cargo Campus Intermodal Campus NS Intermodal Terminal
Port Inland Distribution Network of the Port Authority of New York and New Jersey
Le problème du repositionnement des conteneurs vides Hinterland Global Repositioning Inter-Regional Repositioning (inland) Inter-Regional Repositioning (coastal / fluvial) Regional Repositioning Foreland Port Depot / Inland terminal Freight Distribution Cluster Cargo Rotation
L’insertion du dépôt de conteneurs dans la logistique du conteneur vide Port Port Terminal Shuttles Inland Port / Depot A B Exporter Exporter Importer Importer C