Download
1 / 19
190 likes | 269 Vues
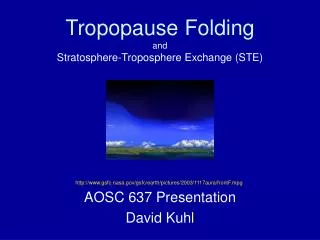
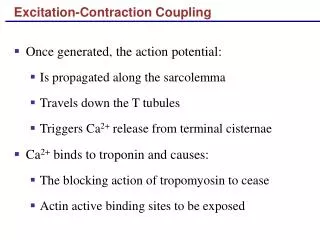
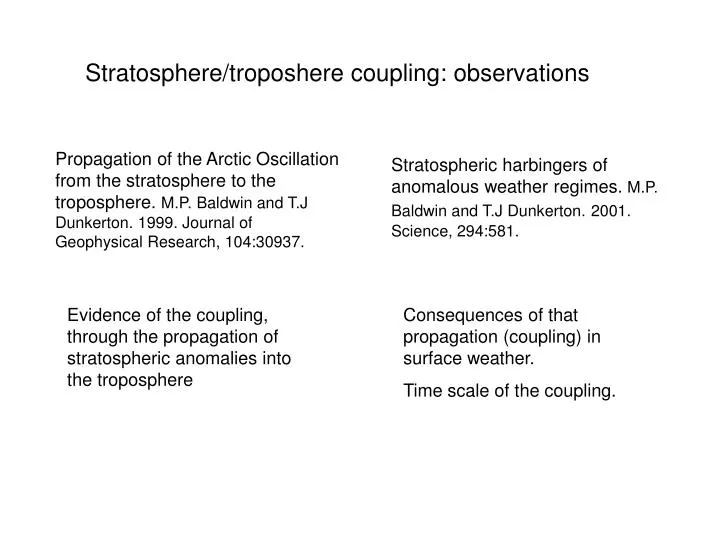
Stratosphere/troposhere coupling: observations. Propagation of the Arctic Oscillation from the stratosphere to the troposphere. M.P. Baldwin and T.J Dunkerton. 1999. Journal of Geophysical Research, 104:30937.

E N D
Stratosphere/troposhere coupling: observations Propagation of the Arctic Oscillation from the stratosphere to the troposphere. M.P. Baldwin and T.J Dunkerton. 1999. Journal of Geophysical Research, 104:30937. Stratospheric harbingers of anomalous weather regimes. M.P. Baldwin and T.J Dunkerton.2001. Science, 294:581. Evidence of the coupling, through the propagation of stratospheric anomalies into the troposphere Consequences of that propagation (coupling) in surface weather. Time scale of the coupling.
Objectives: Examine the coupling between the stratosphere and troposphere using the dominant mode of variability in the northern hemisphere (AO/NAM) Propagation of the Arctic Oscillation from the stratosphere to the troposphere M.P. Baldwin and T.J Dunkerton
Data Daily NCEP reanalysis of geopotential, temperature and wind, 17 pressure levels, from 1000hPa to 10hPa, 1958-1997. AO pattern: leading EOF of 90day-low-pass filtered anomalies December-February north of 20°N at 1000, 300, 100, 30 10 hPa (single field). AO index: daily time series (principal components) of the EOF1 based on the geopotential data. Signatures of AO: regression of the AO index with a data field at each of 17 levels.
Signatures of AO Thompson WJ and JM Wallace. 1998. GRL, 25,1297. Baldwin, MP, X. Cheng and TJ Dunkerton. 1994. GRL, 21,1141
Downward propagation of AO In what degree we can expect to see a pattern representing the AO (at each of the 17 pressure levels) in a daily anomaly map? AO signature, ZxxAO Daily map of deseasoned Zx 10 hPa … … … 1000 hPa …… Day 1 (Jan1, 1958) Day 14609 (Dec 31, 1997) Z= ZxxAO with corresponding to the “best fit” 10 hPa values: AO signature time series … 1000 hPa 1 2 14609
Downward propagation of AO Top: Daily mean 50hPa height averaged over the region poleward of 70°N, with climatological mean removed. Bottom: idem top but for 1000hPa height over the region poleward of 65°. From: Thompson WJ and JM Wallace. 2000. JClim,13,1000.
Objectives: To examine the posibility of using the large stratospheric circulation anomalies as a prediction tool. Stratospheric harbingers of anomalous weather regimes M.P. Baldwin and T.J Dunkerton How: ……time averages and variability of near-surface circulation during 60-day period after the onset of large stratospheric circulation anomalies.
Data November-April, 26 pressure levels, from 1000hPa to 0.316 hPa Annular mode: first EOF of 90day-low-pass filtered anomalies north of 20°N for each pressure altitude. Daily values of annular mode as the projection of the daily geopotential anomalies onto the leading EOF patterns (equivalent to the AO signatures time series) 10 hPa Annular mode values … 1000 hPa 1 2 Dec 31, 1999
Northern annular mode patterns in geopotential at 26 pressure altitudes (hPa), with contours in meters. The patterns represent the first empirical orthogonal function of 90-day low-pass filtered anomalies (for November to April north of 20°N). The 1000-hPa pattern is the Arctic Oscillation.
Composite of large negative and large positive anomalies as measured by the 10hPa annular mode values, defined by the onset of large stratospheric anomalies: Weak -3.0 Vortex events Strong +1.5
What happens with the tropospheric circulation after these extreme events? Weak / strong vortex regimes: 60-day periods after the dates on which the -3.0 and +1.5 thresholds were crossed. Sea level pressure anomalies
Changes in probability density functions (PDFs) of the daily normalized AO and NAO indices Associated with changes in frequency of occurrence of significant weather events (cold outbreaks, snow, high winds) across Europe, Asia and North America. Thompson, DW and JM Wallace. 2001. Science.293:85
Mean latitudes Frequency
Can other stratospheric processes affect the likelihood of extreme events and subsequent changes in weather? Easterly QBO Weak vortex regime SSW (Plate 2 previous paper) Westerly QBO Strong vortex regime Long-range predictability
Summary • Coupling between the stratosphere and troposphere occur in northern winter. • Large-amplitude stratospheric anomalies propagates downward through the troposphere. • Stratospheric anomalies tend to precede tropospheric anomalies (i.e. weather patterns, sfc temperature anomalies). • These stratospheric signals may be used as a predictive tool for surface weather conditions.