Download
1 / 19
190 likes | 346 Vues
Impacts of High Resolution SST Fields on Objective Analysis of Wind Fields. Mark A. Bourassa Center for Ocean-Atmospheric Prediction Studies & Department of Earth, Ocean, and Atmospheric Science, The Florida State University, USA With contributions from Paul Hughes and Ryan Maue, and with

E N D
Impacts of High Resolution SST Fields on Objective Analysis of Wind Fields Mark A. Bourassa Center for Ocean-Atmospheric Prediction Studies & Department of Earth, Ocean, and Atmospheric Science, The Florida State University, USA With contributions from Paul Hughes and Ryan Maue, and with examples form Darren Jackson, Gary Wick, Brent Roberts, Carol Anne Clayson, Dudley Chelton, and Sarah Gille
Broad Goal Narrower Goal • Demonstrate that fine resolution in space and time are important for many applications related to surface turbulent fluxes. Specific Goal • Use high resolution (in space and time) SSTs to improve the quality of gridded ocean surface vector wind products in areas without satellite observations of winds. Understand the SST, winds, fluxes and related variables associated with two-way air/sea interaction on short and long time scales Understand the response and subsequent feedbacks in the atmospheric and oceanic boundary-layers Mark A. Bourassa
Many Air/Sea Interaction Processes- Winds and SSTs are related to many of these processes - Graphic adapted from CBLAST SOLAR RADIATION Wind waves Swell waves SST Mark A. Bourassa
Flux and Wind Accuracies Desired for Various Applications 50 Wm-2 100 years 10 Wm-2 5 Wm-2 Climate Change 1 Wm-2 Meridional Heat Transport 10 years 0.1 Wm-2 Ice Sheet Evolution Annual Ice Mass Budget 0.01 Nm-2 ENSO 1 year Annual Ocean Heat Flux Unknown Coastal Upwelling Monsoon & Seasonal Prediction Open Ocean Upwelling Upper Ocean Heat Content & NH Hurricane Activity 1 month Stress for CO2 Fluxes Dense Water Formation Mesoscale andshorter scalephysical-biologicalInteraction Storm Track Atm. Rossby Wave Breaking Ocean Eddies and Fronts 1 week Ice Breakup Polynyas Shelf Processes 1 day Inertial Forcing Conv. Clouds &Precip NWP High ImpactWeather 1 hour 10m 100m 1km 10km 100km 103km 104km 105km Mark A. Bourassa
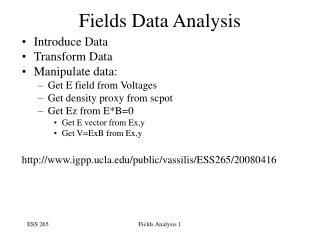
A more accurate approach is to calculate the flux at each time step then average these fluxes: • If we apply Reynolds averaging this equation becomes • If we assume density variations are not important, this equation becomes Submonthly Contribution to Average LHF • L is determined through a bulk formula. • Where the overbar indicates a monthly average • There is considerable controversy about that accuracy of this averaging • Following examples of monthly biases are based on ECMWF reanalysis. • Plots bias from using monthly averaged flux input data • They do not include wave information _ Mark A. Bourassa
January February March Bias in Monthly Latent Heat Flux (1) latent heat flux determined from 6 hourly data and (2) latent heat flux determined from monthly averaged input Monthly climatology computed for 1978-2001 Figures show: (1) minus (2) Probably under-estimated for the Southern Ocean April May June July August September October November December Bias in Latent Heat Flux (Wm-2) Mark A. Bourassa Thanks to Paul Hughes and Ryan Maue
SST effects on wind stress divergence and curl. From Chelton et al (2004). Shown are binned scatter plots of spatial high-pass filtered fields of the wind stress divergence from QuikSCAT as a function of the downwind SST gradient (top row) from AMSR-E and the wind stress curl as a function of the crosswind SST gradient (bottom row) for four geographical regions: the Southern Ocean (60°S to 30°S, 0° to 360°E), the eastern tropical Pacific (5°S to 3°N, 150°W to 100°W), the Kuroshio Extension (32°N to 47°N, 142°E to 170°W), and the Gulf Stream (35°N to 55°N, 60°W to 30°W). Schematic showing the observed relationship of wind stress curl (hashed) and divergence (stippled) to flow across an SST front (thick isotherm). (From Maloney and Chelton (2006)). Mark A. Bourassa
SST Considerations on Winds and Fluxes • The surface humidity is largely a function of the SST • SST modifies the ocean and atmospheric stratification • Transports more or less heat out of the boundary-layer • Mixes more or less momentum down from above • Changing the surface vector winds and fluxes • Modifies the horizontal gradient in air temperature • Changes the surface wind vector and fluxes • Any changes the surface wind speed changes the surface roughness • Further modifies the surface vector winds and fluxes • We are working towards studying these problems • University of Washington Planetary Boundary-Layer Model • Upgraded flux code to be more consistent with satellite observations • Response of SST to winds can be added through POSH and/or a more detailed oceanic boundary-layer Mark A. Bourassa
Example Retrievals of 10m Air Temperature • Multiple linear Regression technique • Pretty good for most conditions • Issues for very low temperature and very high temperatures Mark A. Bourassa NASA SSTST 9
Satellite Retrievals of Air Temperature (at 10m)Comparison With The Latest Techniques Build on collaborations with Jackson and Wick (NOAA & CIRES) and Carol Anne Clayson (FSU) Jackson and Wick Roberts et al. Mark A. Bourassa
Satellite Retrievals of Humidity (at 10m)Comparison With The Latest Techniques Build on collaborations with Jackson and Wick (NOAA & CIRES) and Carol Anne Clayson (FSU) Jackson and Wick Roberts et al. Mark A. Bourassa NASA SSTST 11
Data • Two data sets are used in this study: • Reynolds high resolution SSTs, and • MERRA sea level pressures. • An overly smooth wind field is simulated by interpolating the MERRA sea level pressures (0.5 x 0.66) to the grid spacing of the Reynolds GHRSST product (0.25 x 0.25). • A spline fit is used to greatly reduce spurious spatial derivatives. • The magnitude of vector wind components is related to the pressure gradient; therefore, the vector wind is sensitive to spurious changes in the pressure field. • The University of Washington Planetary Boundary Layer model (UWPBL) is used to find a field of vector winds based on the pressure or the pressure and the SSTs. • The time period of examination is February 2003. The MERRA data are hourly; however, only the data for 01Z are examined herein. This time step is consistent with that of the Reynolds SST product, which has a daily time step. Mark A. Bourassa
Spectral Density of Wind u-component and SpeedFebruary, 2003 Spectral Density (m3s-2) Spectral Density (m3s-2) Speed U-component • The spectral density of wind: u component (left), and speed (right) • Isothermal (black) • latitudes (top to bottom): 55N, 45N, 30N and 20N. • The influence of excessive smoothing is quite evident in the zonal component (left column) for 45 and 55N, at wavelengthes of roughly 100km at 55N, and roughly 200km at 45N. S 107106 105104103102 107106 105104103102 55N 55N • 5000 2000 1000 600 200 100 50 Wavelength (km) 10000 5000 2000 1000 600 200 100 50 Wavelength (km) 107106 105104103102 107106 105104103102 45N 45N 10000 5000 2000 1000 600 200 100 50 10000 5000 2000 1000 600 200 100 50 107106 105104103102 107106 105104103102 30N 30N 10000 5000 2000 1000 600 200 100 50 10000 5000 2000 1000 600 200 100 50 107106 105104103102 107106 105104103102 20N 20N • 5000 2000 1000 600 200 100 50 Wavelength (km) • 5000 2000 1000 600 200 100 50 Wavelength (km) Mark A. Bourassa
Spectral Density of Wind u-component and Speed February, 2003 Spectral Density (m3s-2) Spectral Density (m3s-2) Speed U-component • The spectral density of wind: u component (left), and speed (right) • Isothermal (black) • GHRSST (red) • latitudes (top to bottom): 55N, 45N, 30N and 20N. • The use of GHRSST data largely restores the spectral characteristics lost to smoothing 107106 105104103102 107106 105104103102 55N 55N 10000 5000 2000 1000 600 200 100 50 Wavelength (km) • 5000 2000 1000 600 200 100 50 Wavelength (km) 107106 105104103102 107106 105104103102 45N 45N 10000 5000 2000 1000 600 200 100 50 10000 5000 2000 1000 600 200 100 50 107106 105104103102 107106 105104103102 30N 30N 10000 5000 2000 1000 600 200 100 50 10000 5000 2000 1000 600 200 100 50 107106 105104103102 107106 105104103102 20N 20N • 5000 2000 1000 600 200 100 50 Wavelength (km) • 5000 2000 1000 600 200 100 50 Wavelength (km) Mark A. Bourassa
Findings • Two sets of vector wind fields are generated from MERRA pressures: • One set ignores air temperature, and assumes that there is no surface temperature gradient. • The spectral density for the meridional vector component has a strange bump at around 200km wavelength (100km at 55N). If there were substantial errors in interpolation, they are highly unlikely to be manifested at that wavelength. Consequently, these features are very likely found in the MERRA data set. • One set treats air temperature as equal to the SST • The Reynolds GHRSST data are used (with the MERRA pressure data) • Air temperature is assumed to equal to SST • The spectral densities for these wind vector components are shown as the red lines in Fig. 1. • Changes in slope associated with smoothing are largely removed. • The SST data are remarkably effective for adding information to the wind field. • More testing is needed • Desire to understand what physical processes dominate this coupling Mark A. Bourassa
Plans for the Future • Include Diurnal variability in the SSTs • Create wind fields using UWPBL model • With diurnal cycle winds due to diurnal cycle in SSTs • Use satellite derived Qair & Tair to • investigate links with atmospheric stability and • calculate changes in surface turbulent fluxes • Examine physical processes responsible for linking changes in winds and SST Mark A. Bourassa
Example of Diurnal Changes in SST Based on a modified POSH model and MERRA input for 01/10/2006
Summary • High resolution SSTs are used to add wind information to an overly smooth vector wind field. • The key diagnostic for this study is the spectra density (spatial) of wind vector components and wind speed. • Wind fields are derived from surface pressures through the UWPBL model • (1) A reanalysis pressure field without SST information • The spatial resolution is shown to be limited by smoothing • (2) A reanalysis pressure field with GHRSST information • Finer scales are better represented (from spectral density perspective) • Knowledge of these scales can also be used to determine the averaging scales used in determining tuning parameters in objective analyses. Mark A. Bourassa
Impacts of High Resolution SST Fields on Objective Analysis of Wind Fields Mark A. Bourassa Center for Ocean-Atmospheric Prediction Studies & Department of Earth, Ocean, and Atmospheric Science, The Florida State University, USA With contributions from Paul Hughes and Ryan Maue, and with examples form Darren Jackson, Gary Wick, Brent Roberts, and Carol Anne Clayson