Download
1 / 55
550 likes | 663 Vues
Monitoring of San Francisco Bay. J. R. Schubel AQUARIUM OF THE PACIFIC • LONG BEACH, CALIFORNIA. Is The Whole Less Than The Sum Of The Parts?. San Francisco Bay Area. Urbanization of San Francisco Bay Area 1900 - 1990. San Francisco Bay Area 1850 - 1990. 1850. 1900. Urban Extent

E N D
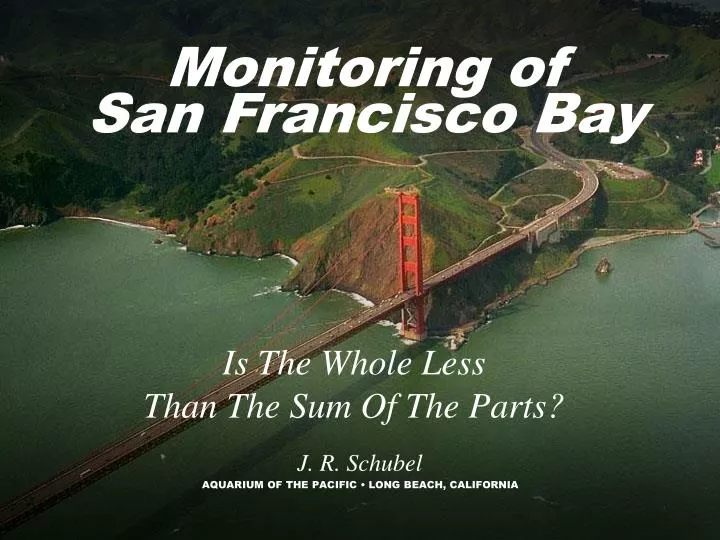
Monitoring of San Francisco Bay J. R. Schubel AQUARIUM OF THE PACIFIC • LONG BEACH, CALIFORNIA Is The Whole Less Than The Sum Of The Parts?
Urbanization of San Francisco Bay Area 1900 - 1990
San Francisco Bay Area 1850 - 1990 1850 1900 Urban Extent Tidal Wetlands Major Earthquakes 1940 1990
Monitoring of San Francisco Bay • Diagnostic? • More than a chronicle of what has happened?
Topics I will Cover: • What is monitoring? Why do we do it? • What monitoring programs currently exist? • What did we learn from the SFO runway reconfiguration assessment experience? • What are the characteristics of a good program? • How many of those characteristics do we find in the San Francisco Bay programs? • Some closing observations.
Topics I will not Cover: • Compliance monitoring programs in the Bay. • Comprehensive, in-depth, descriptions of the “Big 3” Bay Monitoring Programs: • RMP (Regional Monitoring Program) • USGS-RMP (U.S. Geological Survey-Regional Monitoring Program Partnership) • IEP (Interagency Ecological Program)
What Is Monitoring? • Monitoring means to watch, to observe, or check for a special purpose. • Environmental monitoring…“…is generally intended to produce information about three broad categories of problems: (1) compliance, to ensure that activities are carried out in accordance with regulations and permit requirements; (2) model verification, to check the validity of assumptions and predictions used as the basis for sampling design or permitting and for evaluation of management alternatives; and (3) trend monitoring to quantify longer-term environmental changes anticipated (hypothesized) as possible consequences of human activities.” – NRC: Managing Troubled Waters
Why Do We Monitor? • “The ultimate goal of environmental monitoring of all kinds—compliance, model validation and verification, and trends—is protection of the environment, living resources, and human health.”– NRC: Managing Troubled Waters • “But despite these considerable efforts and expenditures, most environmental monitoring programs fail to provide the information needed to understand the condition of the marine environment or to assess the effects of human activity on it”.– NRC: Managing Troubled Waters
San Francisco Bay Area
Current major Environmental Monitoring Programs: • Regional Monitoring Program (RMP) Bay Contaminants Monitoring • U.S. Geological Survey (USGS) Bay Water Quality Monitoring Program • USGS-RMP Joint Monitoring • Suspended Sediments • Nutrients and Phytoplankton • Interagency Ecological Program (IEP) • Fish • Invertebrates • Water Quality
Geographic Range • RMP: SF Bay • USGS: SF Bay to Rio Vista on Sacramento River historically (Now working in the Delta) • IEP: Bay, Delta, and Upstream
Goals, Objectives & Driving Questions • RMP • Water quality objectives compliance • Contaminant spatial and temporal trends • Contaminant sources and loading • Contaminant effects • Synthesis of the sources, distribution, fates, and effects of contaminants in the estuary ecosystem • USGS • Understanding how coastal ecosystems function and how those functions are altered by human disturbances
Goals/Objectives/Driving Questions • IEP Mission:To provide information on the factors that affect ecological resources in the Sacramento-San Joaquin Estuary that allows for more efficient (sic) management of the estuary. • IEP Goals • Understand factors in the Sacramento-San Joaquin estuary controlling the distribution and abundance of selected fish and wildlife resources. • Comply with permit terms requiring ecological monitoring in the estuary. • Identify impacts of human activities on the fish and wildlife resources. • Ensure compliance with Delta water quality objectives. • Make recommendations for water project operation.
Parameters Measured • RMP • Contaminants in water, sediment, bivalves, fish, bird eggs, bird muscle • Contaminant loads from rivers and atmosphere • Toxicity in water and sediment • Toxic effects on birds, fish, seals, benthos • USGS • Nutrients, light, plankton, DO, temperature, and salinity • Sediment dynamics • Hydrodynamics • Pesticides in water • IEP • Fish populations • Zooplankton • Macro-invertebrates • Nutrients, phytoplankton, DO, Salinity
Measurement Frequency • RMP: – Annual (long-term trends), episodic (toxicity, loading) • USGS: • Sediments—ongoing • Nutrients and basic water quality parameters—weekly to monthly • IEP: • Fish Populations—monthly, annual monitoring • Water Quality—daily, monthly
Clients for San Francisco Bay’s Monitoring Programs • RMP • Steering Committee • Regional Board • Wastewater & Stormwater Dischargers/Dredgers • USGS • Regulators • Resource Managers • IEP • Regulators • Resource Managers • Water Contractors • All • Scientists • Public
RMP Technical Reports Newsletters Pulse of the Estuary Journal Publications Website USGS Newsletters Pulse of the Estuary Journal Publications Website with data in “real time” IEP Technical Reports IEP Newsletter Journal Publications Website with data in “real time” Monitoring Products:Transforming Data Into Information
“State of the Bay” Using Monitoring Data • Professional Meetings • San Francisco Estuary Project State of the Estuary Conference (Biennial) • CALFED Science Conferences (Biennial) • IEP Workshop (Annual) • General Publications • IEP Newsletter (Quarterly) and Annual Trends Issue (Annual) • S.F. Estuary Project Newsletter (Bi-monthly) • RMP Pulse of the Estuary (Annual) • TBI/SFEI/CEMAR Indicators
RMP’s Niche • Nearly Exclusive • Systematic monitoring of spatial patterns and long-term trends of contaminants (Some overlap with NOAA Status and Trends and EMAP) • Significant Overlap With Other Programs • Contaminant effects (USGS, USFWL, CALFED) • Contaminant loads (CEP) • Fate modeling (CEP)
This completes a brief overview of the major environmental monitoring programs we have in San Francisco Bay.
Topics I will Cover: • What is monitoring? Why do we do it? • What monitoring programs currently exist? • What did we learn from the SFO expansion assessment experience? • What are the characteristics of a good program? • How many of those characteristics do we find in the San Francisco Bay programs? • Some closing observations.
What’s Missing?Lessons Learned From The SFO Experience • More detailed (temporal and spatial) sampling of water quality in the South Bay, which is the segment of the Bay that would be most likely to be impacted by SFO expansion. • A long-term record of annual sampling of resident demersal fishes and analysis for persistent toxicants and selected histopathological disorders.
What’s Missing?Lessons Learned From The SFO Experience • Bay-wide monitoring of nutrients on a monthly basis. • Bay-wide monitoring of zooplankton on a monthly basis. • Bay-wide monitoring of benthic or epibenthic invertebrates. • Bay-wide monitoring of any ecosystem process, such as primary production, oxygen consumption, system metabolism, sulfate reduction or de-nitrification • Bay-wide monitoring of microbial communities or functions, either in the water column or sediments.
What’s Missing?Lessons Learned From The SFO Experience • Annual sampling of surficial sediments and analysis for chemical concentrations, toxicity in laboratory tests, and composition of the infaunal benthos. • Annual sampling of the sea surface micro-layer several times during a three-month period each year for chemical concentrations, toxicity in laboratory tests, and populations of zooplankton.
What’s Missing?Lessons Learned From The SFO Experience • Bay-wide monitoring on an annual basis quantitative surveys of resident and migratory birds—abundance, distribution, and health. • Bay-wide monitoring on an annual basis of marine mammals with special emphasis on harbor seals (abundance, distribution, haul-out sites, marine foraging sites, etc).
What’s Missing?Lessons Learned From The SFO Experience • Documentation of historical shoreline changes. • A record of sediment bed dynamics: how it responds to different physical forcing functions. • A long-term record of fluxes across sub-basin boundaries of water, salt, sediment, chlorophyll, etc. • Documentation of the effects of wetland restoration projects on the Bay.
What’s Missing?Lessons Learned From The SFO Experience • More frequent (every 10 years) bathymetric surveys of the Bay. • Documentation of historical changes in wetland conditions: area, elevation, vegetation, salinity, etc. • Inputs of water and sediment from the smaller tributaries. • Historical records of water quality in tidal creeks and sloughs.
Lessons Learned from SFO Long-Term Monitoring • A Program that has a statistically valid and spatially comprehensive sampling strategy that allows scientists and managers to quantitatively track changes in the estuary over the long term • A Program built, at least in part, upon the foundation of existing long-term data collection programs • A Program that includes a suite of publicly understandable and meaningful indicators or performance measures that can be used to demonstrate the effects of specific human interventions (individual stressors as well as restoration activities) on species and ecological functions of interest.
Lessons Learned from SFO Long-Term Monitoring • A Program that includes indicators of the trophic levels (e.g., phytoplankton, zooplankton, benthos) that are important to species of concern (fish and wildlife) • A Program that includes indicators of important physical characteristics such as sediment inputs and changes in bay margins (i.e., trends of erosion/accretion) in each region of the bay-delta system • A Program that tracks changes in acres/hectares of specific habitat types in each region of the estuary
Lessons Learned from SFO Long-Term Monitoring • A Program that includes measures of critical contaminants (Se, Hg, PCBs, PAHs, pesticides) in suspended and bottom sediments and in species of concern such as fish, ducks and marine mammals • A Program that includes a requirement of regular reporting of findings/trends to both the resource managers, to scientists, and to the public
Lessons Learned from SFO Long-Term Monitoring • A Program that transforms on a timely basis data into informational products tailored to the needs of different user groups. • A Program that includes a requirement of regular reporting of findings/trends to both the resource managers, to scientists, and to the public
Lessons Learned from SFO Long-Term Monitoring • A Program that has a stable financial base. • A Program that maintains consistent and appropriate methods of sampling that are well documented. • A Program that ensures that species selected for sampling include a broad array of forms likely to be sensitive to perturbations, and once this array has been established, it does not change without serious evaluation.
What Are The Characteristics Of A Good, EffectiveEnvironmental Monitoring Program?
Characteristics Of A Good, Effective Monitoring Program… • Clear goals and objectives stated as questions or hypotheses… questions are better. • Clear, unambiguous identification of the clients— primary and secondary. • Sufficient and stable funding.
Characteristics Of A Good, Effective Monitoring Program… • A measurement program designed to meet the goals and objectives. • Mechanisms to transform the data into a portfolio of informational products designed to answer the questions and appropriate for the clients’ needs. • Scientific community and the public are partners.
Characteristics Of A Good, Effective Monitoring Program… • Periodic peer review. • A chronicle—a running account—of how the data and resulting information are used in making environmental decisions and how the data are used by the scientific community
Characteristics Of A Good, Effective Monitoring Program… • Answer questions/test hypotheses • Provide on-line accounting • Provide early warning • Provide information to decision makers
Characteristics Of A Good, Effective Monitoring Program… • Clients--Know who your clients are and what they need. - Managers - The Public - Scientists - Other • Deliver!
Characteristics Of A Good, Effective Monitoring Program… • Long-term • To be long-term, it must - Be sustainable financially - Have a dedicated revenue stream - Take a minimalist approach to the core - Produce relevant results
Characteristics Of A Good, Effective Monitoring Program… • Emphasize synthesis/integration • Transform data into information • Be Timely • Tell the evolving story in engaging ways
A Few Of The Major Reasons Why Environmental Monitoring Programs Fail: • They produce “answers in search of questions”, i.e. they produce data and not information! • They fail to produce data or information on a timely basis. • They have no constituency. • There is no coupling to managers and their needs. • There is no stable base of sustained financial support.
Topics I will Cover: • What is monitoring? Why do we do it? • What monitoring programs currently exist? • What did we learn from the SFO expansion assessment experience? • What are the characteristics of a good program? • How many of those characteristics do we find in the San Francisco Bay programs? • Some closing observations.
A Monitoring Report Card For The RMP
A Monitoring Report Card For The RMP
A Monitoring Report Card For The RMP
Monitoring of San Francisco Bay Is The Whole Less Than The Sum Of The Parts?
The Power of Simplicity Simplicity is needed at every stage of a regional monitoring program - Design - Execution - Reporting “I wouldn’t give a whit for simplicity this side of complexity, but I would give my right arm for simplicity the other side of complexity.”– Oliver Wendell Holmes “Make it as simple as possible, but not simpler.”– Albert Einstein