Download
1 / 26
260 likes | 422 Vues
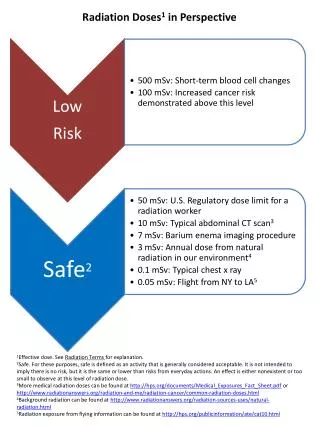
From the histogram to see cycles and dose in radiation . Analysis of relation between radiation-induced chromosome aberration (cycles) and the dose in Gy. Fang-I Chu. Chromosome aberrations ( mFISH patterns for damaged genomes). Project goal.

E N D
From the histogram to see cycles and dose in radiation Analysis of relation between radiation-induced chromosome aberration (cycles) and the dose in Gy Fang-I Chu
Project goal • Compare the cycle frequency under different dose in Gy(for 1, 2, and 4) for two aberration model -breakage-and-reunion (BR model) -recombinationalmisrepair (RM model) and for the experimental data. • Do this for both 2-cycles and n-cycles(n>2).
Why is this important? • Once we gain possible form of function for the BR model and RM model, we will be able to estimate the potential cycle frequency under different dose in Gy • Help us to determine how aberration varies at different dose in Gy.
Introduction of concepts • A cycle of order n, characterized formally by the cyclic graph with 2n vertices, indicates that n chromatin breaks take part in a single irreducible reaction. • Parenthetically grouped elements are arranged in the most conservative way possible, in order to bring an exchange to “closure”. • Closure means all the elements involved in the exchange.
Introduction of concepts • Aberrations result from misrepair of DNA double strand breaks.(DSBs) • DSBs: where both DNA sugar-phosphate backbones of a double helix are broken at nearby sites. • Simple exchange, exchange requires 2 breaks. Which forms a 2-cycle or cycle of order 2 because there are 2 DSBsinvolved.(Giving 4 DSB ends) • Complex exchange, exchange requires more than 2 breaks. Which forms a n-cycle or cycle of order n because there are nDSBsinvolved.(Giving 2n DSB ends)
Concepts(continue) • One-way exchanges, a simple terminal translocation-in which either centric or acentric elements were missing. • Ex.(1’-X’)(1), and (12’T)(12-21’) both of which had missing elements that characterize them as so-called one-way exchange. • Difference between incomplete changes and one way exchanges; the former is with one piece left alone, and the later with one piece attached but it is not visible.
A truly incomplete exchange is identified when a painted fragment accompanied by a bicolor chromosome displays telomere signals on only one end of the fragment. • When the painted fragment in the incomplete exchange displays telomere signals on both ends, the exchange is scored as a false incomplete exchange. • An insertion may involve misrejoining of (a) two DSBs or (b) one DSB on the painted chromosome.
Response about comment :what is the difference bewteen RM (simple) and exchange theory • We can think of exchange is an algorithm, that applied in RM model. • Since simple exchange under RM model just involves 2 DSBs, it can easily be used to explain how exchange algorithm works. • RM and BR are two ways how chromosomes rearrange after radiation; exchange theory is just develop to illustrate the process in between rearrange.
Calculation for number of 2-cycle • Number of 2-cycle=total exchange-number of incomplete exchange-(interstitial deletions- number of acentricrings)+number observed of obligate 2-cycle • Centric rings can be seen, so they are given in experimental data. • We can compute number of acentric rings by introducing a relation parameter 1.2, which gives us: • 1.2*number of centric rings =number of acentric rings
Using the table below to compute number of n-cycle(n>2, 3-cycle, 4-cycle,5-cycle.etc)
How did we get the cycle frequency? • First we can get the number of cycles under the 1 Gy,2 Gy,and 4Gy from the data table in Loucas and Cornforth paper. • Then we calculate the value of cycle number/number of cells scored. • The reason we do this is because we want to get the cycle number of per exposed cell versus dose; since we will simulate the cycles number under thousands of cells using CAS. To unitize the data we got from experiments help us compare on the same basis
Problem we havent solved • We failed to reproduce the histogram graph in Levy et al ‘s paper because CAS didn’t produce number of cycle during simulation. • Need to run the data we get from CAS in another Java program to get the cycle number we need. • Once we manage that, we will be able to get the exact histogram in Levy et al’s paper.
Progress we’ve done this morning.. • We finally manage to transform the file from CAS to get it run in java this morning. • However, there are still problems about the simulation, since we got the same number of cycles when we simulate different number of cells. • Ex. For 20,000 cells at Gy1 we got 23 of 2-cycle and 1 of n-cycle, and we got the same result for 200 cells at Gy 1.
conclusions • The dosage of radiation doesn’t seem to influence the number of cycle linearly as the cycle structure increases. • The patterns of cycle changes response to radiation dosage give the information about how DNA damage is. This could be a way of detecting early formation of tumor. • There should be a more user-friendly software available to simulate cycle number. Currently CAS+Java only run in linux environment, and they require two stages of execution.
Future research • Compute the cycle frequency of 3-cycles,4 cycles, 5 cycles, and n-cycles where n>5, instead of computing n-cycles where n>2. • Draw histogram for about 4 group and the simple exchange group; also after running CAS, we will get comparison histogram for real data, BR, and RM for these five groups. • Observe how the relation between cycle frequency and dose in Gy varies due to different number cycles. • We are also interested in the changes in cycle frequency for higher dosage of radiation, like 6 Gy.8 Gy, 10 Gy.