Download
1 / 62
620 likes | 714 Vues
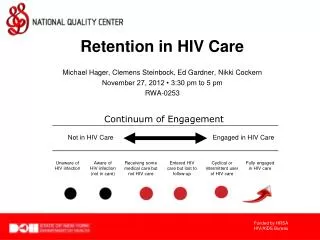
Addressing Disparities to End the HIV Epidemic: Early Lessons Learned from the end+disparities ECHO Collaborative. Clemens Steinbock. HRSA Ryan White HIV/AIDS Program Center for Quality Improvement & Innovation (CQII). Flipchart I – write down 1-2 suggestions:

E N D
Addressing Disparities to End the HIV Epidemic: Early Lessons Learned from the end+disparities ECHO Collaborative Clemens Steinbock HRSA Ryan White HIV/AIDS Program Center for Quality Improvement & Innovation (CQII)
Flipchart I – write down 1-2 suggestions: Data Stratification: How can we best break down VL performance data to identify disparities and gaps in care? Flipchart II - write down 1-2 suggestions: Using Data for QI: What strategies do you suggest to use disparity data findings for QI activities? Flipchart III - write down 1-2 suggestions: QI Activities: Can you share a best practice to work toward eliminating HIV disparities? Flipchart IV - write down 1-2 suggestions: Consumer Involvement: How can consumers been involved at all levels? Audience Questions – Best Practices
Opening remarks Opening Remarks
Setting the Stage CQII Overview Learning Objectives Agenda Review Introductions
Picture Consent • You allow CQII to take pictures from our training events and to post them on our websites, social media platforms, and other marketing materials for an undetermined period of time • You have the right to revoke your consent for pictures that are publicly posted • At no time, individual names will be used to identify you, unless you sign the appropriate release form
Learning Objectives Describe quality improvement interventions conducted by Ryan White HIV/AIDS Program recipients to end disparities in HIV care Identify disparities in HIV care using the CQII-developed Disparities Calculator Exchange ideas with other recipients on how to engage other stakeholders in local jurisdictions to end disparities
Agenda Setting the Stage – 15min end+disparities ECHO Collaborative Overview – 20min Affinity Groups – 5min Collaborative Performance Data – 5min Panel Discussion – 35min QI Resources – 5min CQII at the RW Conference – 5min
Introductions Introductions
Are you currently participating in the Collaborative? Yes/No If yes, what is your role in the Collaborative? If yes, what has been your lessons learned so far? What type of agency do you work for? Network Agency, such as Part A, Part B Provider Agency, such as Part C, Part D Do you actively work on reducing HIV disparities? Yes/No Audience Questions
Flipchart I – write down 1-2 suggestions: Data Stratification: How can we best break down VL performance data to identify disparities and gaps in care? Flipchart II - write down 1-2 suggestions: Using Data for QI: What strategies do you suggest to use disparity data findings for QI activities? Flipchart III - write down 1-2 suggestions: QI Activities: Can you share a best practice to work toward eliminating HIV disparities? Flipchart IV - write down 1-2 suggestions: Consumer Involvement: How can consumers been involved at all levels? Audience Questions – Best Practices
Collaborative overview Collaborative Overview
MSM of Color 1 in 11 White MSM will be diagnosed with HIV in his lifetime 1 in 4 Hispanic MSM will be diagnosed with HIV in his lifetime 1 in 2 African American MSM will be diagnosed with HIV in his lifetime CDC/NCHHSTP. 2016 conference on retroviruses and opportunistic infections--CROI graphics: lifetime risk of HIV diagnosis in the United States. Updated 2016 Feb 24. Available from http://www.cdc.gov/nchhstp/newsroom/2016/croi-2016.html
HIV Care Continuum (African American MSM vs. White MSM) African American MSM are 47% less likely than White MSM to achieve viral suppression (16% vs 34%). Rosenberg ES, Millett GA, Sullivan PS, del Rio C, and Curran JW. Understanding the HIV disparities between Black and White men who have sex with men in the USA using the HIV Care Continuum: a modelling study. Lancet HIV. 2014;1(3):e112-e118.
Black/African American and Latina Women 62% of new HIV infections among women occur among African American women 13% of the U.S. female population are African American women CDC. HIV/AIDS Resource Library Slide Sets: HIV surveillance in women (through 2014). Updated 2016 Feb 26. Available from http://www.cdc.gov/hiv/pdf/library/slidesets/cdc-hiv-surveillance-women-2014.pdf
Youth (13-24) HIV Care Continuum in HIV-infected Youth in the United States Only 6% of youth are estimated to be virally suppressed, compared to an average rate of 30% across all age groups. Zanoni BC and Mayer KH. The adolescent and young adult HIV cascade of care in the United States: exaggerated health disparities. AIDS Patient Care STDS. 2014;28(3):128-35. CDC, http://www.cdc.gov/hiv/pdf/library/factsheets/understanding-hiv-care-continnum.pdf
Transgender People 1 in 250 odds of having HIV as an adult of reproductive age 1 in 5 odds of having HIV as a transgender woman Transgender People are 49 times more likely to acquire HIV than all adults UNAIDS. Countries: United States of America—HIV and AIDS estimates (2012); CDC. HIV/AIDS: HIV among transgender people. Updated 2016 Apr 18. Baral SD et al. Worldwide burden of HIV in transgender women: a systematic review and metaanalysis. Lancet Infect Dis. 2013;13(3):214–222.
Collaborative Overview • Each Collaborative participant is asked to focus their improvement efforts on one identified subpopulation • Participants join virtual special-interest groups based on shared interests, such as subpopulations (Affinity ECHO Session) • Recipients and subrecipients partner with other local HIV providers to form regionally-based improvement groups (Regional Group) • Learning sessions with all participants are held every five months, starting Jun 2018 and ending Sep 2019
end+disparities ECHO Collaborative Participants Arizona California Regional Group Mavericks Regional Group Louisiana Maryland Massachusetts / New Hampshire Mississippi Missouri New York Regional Group North Carolina Ohio South Carolina South Florida Tennessee / Kentucky Texas Washington State Washington, DC / Virginia end+disparities ECHO Collaborative Enrollment Data: May 25, 2018
end+disparities ECHO Collaborative Reach • Enrollment Data • 17 Collaborative Teams = largest HAB/NQC/CQII Collaborative Ever! • 30/50 States/Territories are represented in the Collaborative • 11 States/Territories alone in the Mavericks Regional Group • 52% of Part As (27/52) and 35% of Part Bs (18/51) participate • Collaborative has the potential to reach an estimated 145,000 or 43% of all Ryan White patients (RSR 2016 Data) – 1 in every 2.3 RWHAP patients! • 8 out of 15 states with the lowest viral suppression rates are participating, as well as 9 out of 15 Part As with the highest number of RWHAP clients We Reached Our Enrollment Goal! end+disparities ECHO Collaborative Enrollment Data: May 25, 2018
Collaborative tools Collaborative Tools
Collaborative Toolkit I) Collaborative Overview • Overall Collaborative Goals and Aims • Benefits of Participation • Overall Expectations for Participation II) Pre-Work Activities • Identify One Disparity Subpopulation • Developing Aim Statements • Regional Response Team III) Learning Sessions IV) Regional Groups • Finalize the Regional Response Team • Write a Regional Quality Management Plan and Regional Sustainability Plan • Conduct Training Opportunities for Providers and Consumers V) Affinity ECHO Groups • Subpopulation-Specific Affinity ECHO Sessions • Preparing Case Presentations VI) Viral Suppression Performance Measurement Reporting VII) Quality Improvement Intervention Submission
Disparities Calculator • The Disparity Calculator is a MS Excel spreadsheet to automatically calculate HIV performance data and highlight the presence and severity of disparities
Intervention Grid • The Intervention Grid outlines evidence-based/informed interventions to address disparities in HIV care
Detailed Literature Review Review detailed literature review findings on disparities in HIV care for each subpopulation Download a detailed slide set with findings from the literature review Review the findings with staff and locally/regionally share with consumers https://cqii.glasscubes.com/share/s/lbq69neurq5dustcd7934v7r40
Mobile App for Collaborative • Allows participants to communicate directly with other participants • Learn more about the Collaborative and access documents • See upcoming events and access directly through the phone • Push notifications to alert participants of any changes or send reminders enddisparities.CQIIApp.org
Affinity Groups Affinity Groups
Typical Agenda • Welcome & Introductions • Didactic Presentation by a Content Expert • Case Presentation by a Community Partner • Group Discussion • Next Meeting Details Together, let’s improve and eliminate HIV disparities
Affinity Group Participation • Participation • Over 200 individuals successfully participated in the first Affinity ECHO Sessions in July 2018 focusing on four identified HIV subpopulations. end+disparities ECHO Collaborative Data: July 31, 2018
Affinity Case Presentation Template Presented By: [insert name and email here) Organization: [insert agency here] Area of Focus: [system challenge or intervention/best practice] Affinity Group: [insert subpopulation here] Date: [insert date here]
Performance Data Performance Data
end+disparities Database • Features of the end+disparities Database: • Easy to use online application • Immediately trends entered performance data over time • Group Regional Groups to produce regional performance scores • Benchmarking function compares all submissions by Collaborative participants • The Response Team Data Liaison and the assigned Coach have access
end+disparities Benchmark Report • The average Collaborative viral suppression rate is 83.5% (n=130,159); HIV subpopulations: Black/African American and Latina Women: 84.2%; MSM of Color: 80.7%; Transgender: 77.2%; Youth: 73.4% • The overall goal is to reach 87.6% by the end of the Collaborative (decreasing the individuals who are not virally suppressed by 25%) and to have 5,375 PLWH additionally virally suppressed by the end of the Collaborative
Panel Discussion Panel Discussion
Panel Discussion - Panelists Aaron O'Brien Adam Thompson ChinosoUkachukwu Jose Delao Justin Britanik Julia Schlueter
Panel Discussion – Key Questions How have participants used and benefited from the Collaborative tools? What are the experiences so far in collecting and using the Collaborative performance data for quality improvement? What are some lessons learned to bring RWHAP recipients/subrecipients together in Regional Groups? How has the participation in Affinity Groups benefitted participants in addressing disparities? How have consumers been involved at all levels in the Collaborative? What is the role of the QI Coaches in the Collaborative?
Panel Discussion – Optional Questions Capturing QI intervention/PDSA Cycle information Intersectionality between Affinity Sessions and Regional Groups Affinity Presentations – What have you done with the recommendations? Running virtual Learning Sessions Response Team structures and feedback How can we structure the communication flow (method, frequency, etc.) to keep everyone informed while not overwhelming participants?
Aha! Moments Aha! Moments