Download
1 / 11
110 likes | 289 Vues
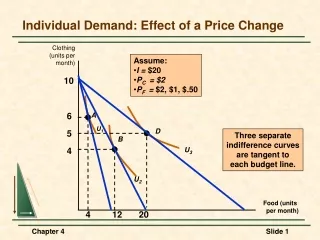
Measure effect of Price Change of An Item on Market Basket. Mayur Sedani Sr. Merchandising Analyst Pricing and Product Optimization AutoZone Inc. Background on Market Basket (MB) Analysis. Aimed at providing insight into combination of products sold together (in a customer basket)

E N D
Measure effect of Price Change of An Item on Market Basket Mayur Sedani Sr. Merchandising Analyst Pricing and Product Optimization AutoZone Inc.
Background on Market Basket (MB) Analysis • Aimed at providing insight into combination of products sold together (in a customer basket) • The insights obtained from MB analysis can be used for: • Product promotion strategies • Product placements decisions in stores • Product pricing decision • Our Objective: Find the impact of changing price of an item on Market Basket revenue
Steps in MB Impact Calculation • Find the general Affinity between products • Find Affinity index in Test and Control Stores • Select item-Category Pairs (MB pairs) • Calculate MB Impact • All data manipulation and calculations were done in SAS
Find Affinity between Products • Find % of time Product from Category B is sold when Item A is sold (last 6 months) • This is defined as the Affinity between Item A and Category B • Higher the Affinity more the likelihood for Market Basket behavior
Affinity Index – Test and Control • Find Affinity Index (between item A and Category B) before and After Price Change • a-t: pre 8 week affinity index in the Test Stores • a+t: post 8 week affinity index in the Test Stores. • a-c: pre 8 week affinity index in the Control Stores • a+c: post 8 week affinity index in the Control Stores.
a+c/ a-c should be within 0.9 and 1.1 If Driver item Price Increased If Driver item Price Decreased a6 0.5 0 0.9 1 1.1 a+c/ aor a+t/ a-t Select item-Category Pairs (MB pairs)
Select item-Category Pairs (MB pairs) contd… • Condition1: a6 > 0.05 • Condition 2: • Condition 3: • If Price Increase: • If Price Decrease:
Questions or Comments Thank you!