Download
1 / 19
190 likes | 318 Vues
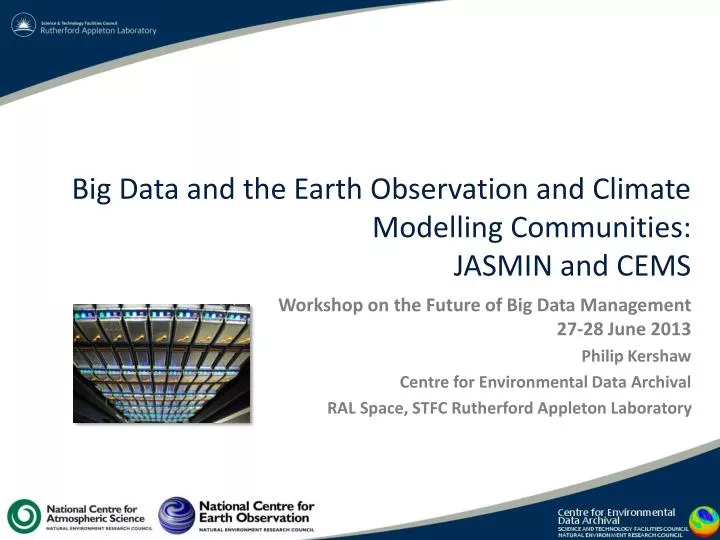
Big Data and the Earth Observation and Climate Modelling Communities: JASMIN and CEMS. Workshop on the Future of Big Data Management 27-28 June 2013 Philip Kershaw Centre for Environmental Data Archival RAL Space, STFC Rutherford Appleton Laboratory. Some Challenges.

E N D
Big Data and the Earth Observation and Climate Modelling Communities:JASMIN and CEMS Workshop on the Future of Big Data Management27-28 June 2013 Philip Kershaw Centre for Environmental Data Archival RAL Space, STFC Rutherford Appleton Laboratory
Some Challenges • Velocity – a data deluge • Earth Observation e.g. new generation of ESA Sentinel satellite missions, S-3 ~1PB/year • Volume • Climate modelling e.g. the CMIP3 generated 35TB in one central archive, CMIP5 > 2PB in a federated archive. • Variety • Not a new factor to our community (a topic for another talk) • We run a number of active data archives • the data lifetime is an important factor, we need to keep the data – in the case of CMIP5 indefinitely • The availability of the data: we have a responsibility to a much wider and set of communities than merely those who created the data • How do we analyse the data? • How responsive can we be with the hardware and software we use to address the needs?
Presentation Structure • Introduce CEDA • Tell a story starting with, • What life was like before JASMIN and CEMS • System description • Initial application of the infrastructure for: • Archive management • Data handling and analysis for Climate model data • Earth Observation data reprocessing • How patterns of usage have emerged from these experiences • How these patterns are influencing our future plans
CEDA – The Centre for Environmental Data Archival • Our mission: • to curate data and • facilitate science • We run 3 NERC data centres • 20 projects underway currently covering • Data modelling, preservation, publishing • Web applications and services • Cloud computing • http://www.ceda.ac.uk
Life before JASMIN and CEMS • Snapshot at the beginning of 2012, infrastructure hosted within RAL Space: • 200 million files • ~1.5PB of NAS disk on • ~150 disk partitions, split into 600 datasets • ~300 different computers, incl. VMs • ~30 hypervisors (Xen) • Lots of tapes in STFC Atlas data store • This was not a designed environment, it was organic, it grew over a decade • CEDA was straining under this legacy: • inexplicable network problems. • lots of time spent moving data as machine lifetimes expired • user services suffered. • It has taken us a year to migrate our data to JASMIN, it'll probably take nearly as long to retire all the services on legacy hardware
Introducing JASMIN and CEMS Panasas storage in RAL R89 server room • Petascale fast disk via low latency networks • Supports batch processing, hosting environments and Cloud • Supports two communities atmospheric science and earth observation (CEMS) • Initially funded through e-Infrastructure capital investment in 2011through BIS • CEMS – the facility for Climate and Environmental Monitoring from Space • CEMS consists of two components: • the academic CEMS infrastructure, running on JASMIN • commercial CEMS infrastructure part of the new UK Satellite Applications Catapult centre JASMIN and CEMS Electron Building, Catapult R89 Building, RAL STFC CEMS Commercial CEMS Academic JASMIN Shared infrastructure and overlapping research domains Physical network link, Sharing of expertise, collaboration
JASMIN-CEMS topology • 6 major components to the system: • The low latency core network (based on Gnodal switches); • The Panasasparallel storage • The batch compute system (Lotus); • bare metal compute and hypervisors for virtual machines (VMs); • A High Memory System and • Two image stores to support the private disks of VMs.
Distributed JASMIN Infrastructure JASMIN-North University of Leeds 150 TB JASMIN-Core STFC RAL 3.5 PB + compute JASMIN-West University of Bristol 150 TB JASMIN-South University of Reading 500 TB + compute
Links to HPC Facilities HECToR Cray XE6, 90k cores (to be replaced with ARCHER) • For the modelling community - provide dedicated links to HPC facilities • JASMIN – provide one place to analyse outputs • But also combine outputs from multiple sources MONSooN 5000 core IBM P7
Virtualisation and Cloud • VMware and vCloud chosen • Why not Open Source? • Capital expenditure project + short time scales • Assessment of maturity of Open Source solutions at the time • Organised into two vSphere pools • JASMIN using virtualisation only • CEMS full vCloud • RHEL, CentOS, Fedora14 vApps • 6 Virtual Data Centres (vDC) • Web interface available to Plymouth Marine Laboratory • Interest in larger VMs with batch queues • vCloud REST API very promising but still to be fully exploited • Issues: • Remote root console access • Panasas file system integration from libcloud.compute.types import Provider from libcloud.compute.providers import get_driver vcloud_driver = get_driver(Provider.VCLOUD) self.conn= vcloud_driver(‘pjkershaw’, passwd, host=“cemscloud.jc.rl.ac.uk”, api_version='1.5’) # Query VM images available images = self.conn.list_images() log.info('CreatingvApp ...') node= self.conn.create_node(name='Phil-Test-Node01’, image=images[0])
Disk usage • 4.6PB deployed in 6 Hours! • Migrating the archive from the legacy NAS storage was a whole project in itself – 6 months • Reaching capacity in under a year! • Filling both the archive volumes and Group workspaces (user caches) $ df –h Filesystem Size Used Avail Use% Mounted on nfs01.jc.rl.ac.uk:/ 4.9P 3.0P 2.0P 61% /mnt/nfs01
Data Archive: CMIP5 • CMIP5 (5th Coupled Model Intercomparison Project) has so far produced over 2 PB of requested data from over • 100 different numerical experiments run by 29 different modellingcentres • using 61 different climate models. • Stored in a globally distributed archive currently using 23 geographically distinct data nodes (the Earth System Grid Federation) • Three centreshave agreed to manage replicates of as much of the requested data as possible including • British Atmospheric Data Centre (a core component of CEDA).
Climate Modelling: UPSCALE • A high resolution climate modellingexperiment, run under the UK Joint Weather and Climate Research Programme (JWCRP, joint between NERC and the UK Met Office) • 144 million core hours on the German supercomputer HERMIT, producing 330TB. • The data retrieved to JASMIN over GridFTPat 1-10 TB/day. • At JASMIN, a second copy was kept until the data had also been copied to the Met Office tape • At its peak, the UPSCALE archive online at JASMIN approached 600TB - and it is now around 380TB (including post-processed products). • These data are expected to provide a hugely valuable resource for the study of current and future climate, => feed into ESGF and the CEDA archive. • Benefit of single analysis environment: • post-processing involves comparisons with CMIP5 and earth observation data held within JASMIN.
Earth Observation: ATSR Processing • Examples (re)processing for whole satellite missions, a job that hitherto was done rarely. • A number of different groups generated products from (the Along Track Scanning Radiometer) using brightness temperature data held in the CEDA archive: • Cloud detection and sea surface temperature • Land surface temperature • Cloud ECV (Essential Climate Variable) • Trivial to parallelise • They had prior evidence of being i/o bound on previous hosting environments LST plot for the UK [John Remedios and Darren Ghent, University of Leicester].
ATSR1 and 2 Reprocessing Project 140-185 jobs in parallel with no IO issues. • Virtualised environment for initial trials: • cores/VM, memory, operating system • This showed that standard CEMS Redhatdistro was fine => suitable for bursting to JASMIN’s Lotus compute cluster • One month’s L1B data processing in 12 minutes where on previous system it took 3 days • Impact of parallisation and fast i/o • LSF was used for job scheduler so that adding Lotus to the processing was simple. • A hybrid approach: compute cluster + VMs • Importance of documentation and direct support to orient users and enable them to avoid pitfalls Each colour represents a node, 12 cores / node 3.0GB/s x 8 = 24Gb/s (would swamp a NAS/NFS server)
Future Plans JASMIN / CEMS Academic [R89 Building STFC Rutherford Appleton Laboratory] • Provided a range of service models • Direct access to the data archive and compute • Performance • Great level of trust with user • Set-up time and training • Virtualisation • Flexibility for management of system • Greater autonomy for user • Performance overhead (and expense VMware) • Private Cloud • hosted on an independent internal network for greater security but also autonomy • Less privileged access to the archive • Possibility of moving storage and compute between environments dynamically • Nodes can be run as hypervisors or bare metal compute Data Archive and compute Protected area Bare Metal Compute Panasas Storage Virtualisation Cloud burst as demand requires Internal Private Cloud External Cloud Providers Cloud Federation API Direct access to the data archive - Hosted processing and analysis environments
Conclusions • The role of a dedicated data analysis environment integral to our support for Big Data for EO and atmospheric science for the forseeable future • The first projects have show the impact such an infrastructure can make on the science • Data curation – we could not have gone as we had before • A lot to handle in a very short space of time • Scratching surface about data analysis issues • Looking to the future, use a flexible combination of processing clusters, virtualisation and public and private Cloud to best support the usage patterns
Lower level of trust in user => <= Increased level of trust in user Users and usage Great security risk usage patterns Increased set-up time, but longer usage More dynamic and autonomous usage patterns PaaS – Hosted Analysis Environments Application Hosting Hosted Processing Hosted Infrastructure Service Offered Shared Scientific Analysis hosts SOA High performance file system Cloud Federation / Brokering Virtual Infrastructures for other organisations Virtual Storage Bare metal Increasing virtualisation => Direct Access to the File System Cloud platform Virtualisation and networking Isolated network Sandboxed environments