Download
1 / 1
10 likes | 113 Vues
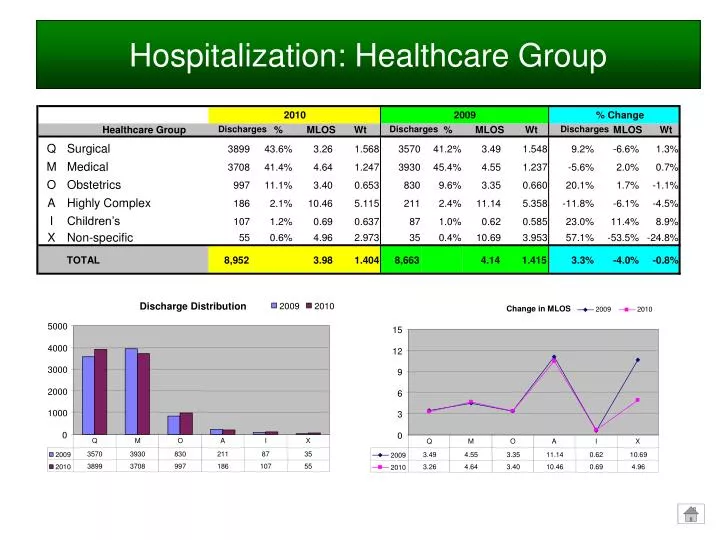
2010. 2009. % Change. Healthcare Group. Discharges. %. MLOS. Wt. Discharges. %. MLOS. Wt. Discharges. MLOS. Wt. Q. Surgical. 3899. 43.6%. 3.26. 1.568. 3570. 41.2%. 3.49. 1.548. 9.2%. -6.6%. 1.3%. M. Medical. 3708. 41.4%. 4.64. 1.247. 3930. 45.4%. 4.55.

E N D
2010 2009 % Change Healthcare Group Discharges % MLOS Wt Discharges % MLOS Wt Discharges MLOS Wt Q Surgical 3899 43.6% 3.26 1.568 3570 41.2% 3.49 1.548 9.2% -6.6% 1.3% M Medical 3708 41.4% 4.64 1.247 3930 45.4% 4.55 1.237 -5.6% 2.0% 0.7% O Obstetrics 997 11.1% 3.40 0.653 830 9.6% 3.35 0.660 20.1% 1.7% -1.1% A Highly Complex 186 2.1% 10.46 5.115 211 2.4% 11.14 5.358 -11.8% -6.1% -4.5% I Children’s 107 1.2% 0.69 0.637 87 1.0% 0.62 0.585 23.0% 11.4% 8.9% X Non-specific 55 0.6% 4.96 2.973 35 0.4% 10.69 3.953 57.1% -53.5% -24.8% TOTAL 8,952 3.98 1.404 8,663 4.14 1.415 3.3% -4.0% -0.8% Discharge Distribution 2009 2010 Change in MLOS 2009 2010 5000 15 4000 12 3000 9 2000 6 1000 3 0 0 Q M O A I X Q M O A I X 3570 3930 830 211 87 35 2009 3.49 4.55 3.35 11.14 0.62 10.69 2009 3899 3708 997 186 107 55 2010 3.26 4.64 3.40 10.46 0.69 4.96 2010 Hospitalization: Healthcare Group