Download
1 / 37
390 likes | 538 Vues
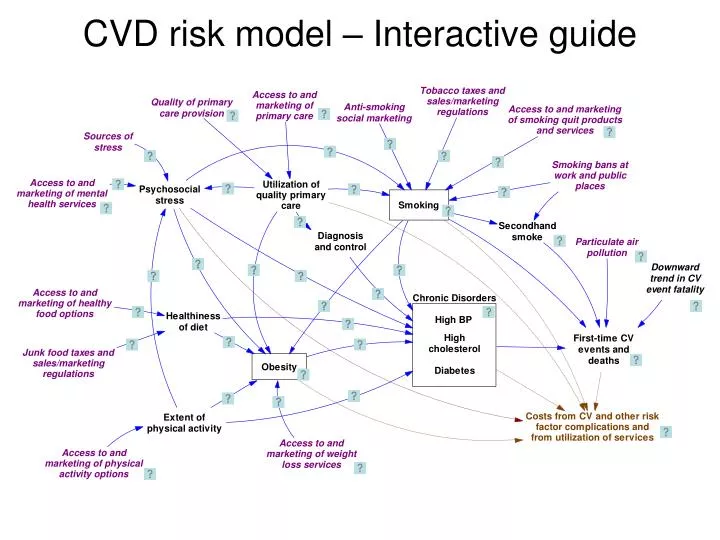
CVD risk model – Interactive guide. Cardiovascular events. First-time CV events are CHD, Stroke, Combined CVD (CHD, Stroke, CHF, PAD), and Deaths from CVD events

E N D
Cardiovascular events • First-time CV events are • CHD, • Stroke, • Combined CVD (CHD, Stroke, CHF, PAD), and • Deaths from CVD events • Coefficients and synergies of chronic disorders and smoking based on Anderson Am Ht J 1991 (Framingham data 1968-87), and adjusted to reflect AHA event rates reported for 2003
Decline in CV event fatality • Case-fatality trends for MI, Stroke, and CHF from NHLBI Chartbook 2007 • With 2003=1, calculate weighted average 1990=1.39, 1995=1.175, 2000=1.09
Chronic disorders Adults With High BP (Non-CVD) • Chronic disorder prevalences in non-CVD population from NHANES 1988-94 and NHANES 1999-2004; definitions: • High BP: SBP>140 or DBP>90, or told 2+ times, or on BP meds • High cholesterol: LDL>130, or ever told • Diabetes: FG>126, or ever told • Adult prevalence of each chronic disorder is modeled as a stock affected by onset, by carryover of the condition in teens turning 18, and by deaths (related to CVD and otherwise). • A disorder’s prevalence in age 18 is assumed to equal 70% of the corresponding NHANES prevalence in Age 18-29. This is in line with the 70-80% ratio seen for obesity (NHANES, CDC Obesity Dynamics Model). • Onset rates for high BP, high cholesterol, and diabetes adjusted to reproduce NHANES prevalence trends by sex and age. Becoming hypertensive Having CVD events or dying % High BP 0.4 0.2 1990 2040 Adults With High Cholesterol (Non-CVD) Having CVD events or dying Getting high cholesterol % High Chol 0.8 0.2 1990 2040 Diabetic Adults (Non-CVD) Having CVD events or dying Becoming diabetic % Diabetic 0.1 0.04 1990 2040
Diagnosis & control of disorders • Historical diagnosed and controlled fractions in non-CVD population • estimated from NHANES 1988-94 and 1999-2004 • by age and sex • e.g. for the latter period in female 65+: • High BP: • Diagnosed = 65%; • Ctrl (SBP<140 & DBP<90) fraction of diagnosed = 44% • High cholesterol: • Diagnosed = 72 • Ctrl (LDL<130) fraction of diagnosed = 51% • Diabetes: • Diagnosed = 76% • Ctrl (HbA1c<7) fraction of diagnosed = 64%
Primary care to diagnosis & control • Relative gaps in diagnosis and control for chronic disorders if using high-quality primary care, vs. if using mediocre care or no care: 0.3 [0.2-0.4] (Austin team)
Quality of primary care • Quality of primary care (for those using it) found to lie in range of 50-58% • Varying only a bit by sex, age, income, etc. (Asch NEJM 2006: RAND study of medical records in large 12 cities for 30 medical conditions, N=6,712)
Primary care services • BRFSS 2004-06 indicates 66% with “check-up last year” • Proxy for access is health insurance (Census); 84% in US 2006. • These numbers suggest 79% of people with access regularly use primary care • Media promotion of primary care could increase this to perhaps 85% [79%-95%] (Austin team)
Obesity Obese Adults Newly obese adults Becoming non-obese or dying • Obesity is defined as Body Mass Index > 30. Adult obesity prevalence is modeled as a stock affected by flows of becoming obese and becoming non-obese, by obese teens turning 18, and by deaths (related to CVD and otherwise). • Historical estimates of prevalence among non-CVD adults from NHANES 1988-94 and 1999-2004 by sex and age group. • Historical estimates of Age 18 obesity by sex from NHANES • Baseline rates of becoming obese and becoming non-obese based on CDC Obesity Dynamics model, and adjusted to reproduce NHANES adult obesity trends by sex and age. % Obese 0.4 0 2040 1990
PA & diet to obesity • Relative Risk = 2.6 for becoming obese due to lack of physical activity (Haapanen et al Intl J Obesity 1997) • Literature implicates poor diet as much as lack of PA for obesity epidemic, so a similar relative risk is assumed due to lack of healthy diet: 2.6 [2.4-2.8].
Smoking to obesity • Smoking reduces appetite, and therefore the rate of becoming obese; • Relative Risk = 0.78 (Flegal AJPH 2007)
Impact of weight loss services • Weight loss services can increase rates of obese people becoming non-obese. • Estimate multiplier of 2.2 [1.4-3.0] based on Dansinger et al JAMA 2005, and NIH Guidelines 1988 (pp. 42-55) for potential additional weight loss from programs of diet alone or diet plus PA.
Weight loss services • We estimate 50% [40%-60%] of obese in the US have access to (can afford) WL services, and 20% [15%-25%] of those with access utilize them (Austin team). • This gives 10% baseline estimate of utilization. Compare Kruger et al AJPH 2004: 5-8.5% of obese people use WL programs, pills, or supplements. • Media promotion of WL services could increase usage by factor of 1.2 [1.0-1.5] (Austin team). • High-quality primary care, through referral, increases usage of WL services by factor of 1.25 [1.0-1.5] compared with no or mediocre primary care (Austin team).
Obesity to chronic disorders • Obesity increases risk of onset of high BP, high cholesterol, and diabetes • Relative Risks (by age and sex) calculated from prevalence ratios in Thompson Arch Intern Med 1999; • Estimated Relative Risk ranges: • High BP 3.0 to 4.4 • High cholesterol 1.9 to 2.2 • Diabetes 3.8 to 4.4
Smoking • Historical estimates of current smoking prevalence among non-CVD popn from NHANES 1988-94 and 1999-2004 by sex and age group. • Smoking prevalence in adults is modeled as a stock affected by flows of initiation and quitting, by the inflow of teen smokers turning age 18, and by deaths (related to CVD and otherwise). • Historical estimates of Age 18 smoking fraction by sex from YRBSS. • Baseline rates of adults quitting smoking based on Mendez & Warner AJPH 2007 and Sloan et al MIT Press 2004 (Fig. 2.1) • Baseline rates of adult initiation/relapse adjusted to reproduce NHANES adult smoking trends by sex and age. Smoking Adults Newly smoking adults Quitting or dying % Smokers 0.3 0 2040 1990
Smoking to diabetes • Smoking increases the risk of diabetes onset; • Estimate Relative Risk = 1.44 [1.31-1.58] from Willi, JAMA 2007.
Anti-smoking social marketing • Anti-smoking social marketing can increase quits moderately; • Estimate 1.3 [1.2-1.5], based on T Pechacek (citing CPSTF) and Austin team. • It also reduces adult relapse; • Estimate multiplier of 0.5 [0.3-0.7], based on T Pechacek and Austin team. • It also reduces smoking among teens; • Estimate multiplier of 0.5 [0.4-0.7], based on T Pechacek and Austin team.
Tobacco taxes & sales restrictions • As of 2007, the average state tax was $1.07 per pack, with New Jersey the highest at $2.58 per pack. We have initialized the tax-and-restrict input at “0.5” out of a maximum 1.0 for the US overall. • Tax-and-restrict can increase quits significantly; estimate 1.85 [1.5-2.5] (from T Pechacek and Austin team). • It also reduces adult relapse; estimate multiplier of 0.7 [0.5-0.8] (from T Pechacek and Austin team). • It also reduces smoking among teens; estimate multiplier of 0.6 [0.4-0.7], based on T Pechacek and Austin team. T Pechacek cites study showing youth smoking down 7% for each 10% increase in price. Compared with no tax and base pack price of $3.50, this would give 40% reduction for $2.00 tax as in Connecticut, and 60% reduction for $3.00 tax as in New York City.
Impact of smoking bans on smoking • Workplace smoking bans increase quitting among those who work; estimate 1.25 [1.2-1.4], based on T Pechacek (citing CPSTF) and Austin team. See also Moskowitz et al AJPH 2000 and Glasgow et al Tobacco Control 1997. • Bans also reduce adult relapse; estimate multiplier of 0.6 [0.5-0.7], based on T Pechacek and Austin team. • Bans also reduce smoking among teens who work; estimate multiplier of 0.65 [0.55-0.75], based on T Pechacek and Austin team. See also Farkas et al JAMA 2000.
Impact of smoking quit services • Smoking quit services & products can increase smoking quit rates. • Estimate multiplier of 2.25 [1.5-3.0] based on responses from A Rosenthal, T Pechacek, and Austin team. Terry P cites studies: Nicotine replacement therapy alone boosts quits 50-100% and counseling alone also by 50-100%.
Smoking quit services & products • We estimate 50% [33%-60%] of smokers in the US have access to (can afford) SQ services & products (based on T Pechacek and Austin team), and 20% [10%-30%] of those with access utilize them. • This gives 10% baseline estimate of utilization. This 10% figure accords with MEPS data on spending per smoker. Compare Terry P estimate of 7.5% of smokers using nicotine replacement products plus counseling. • Media promotion of SQ services & products could increase usage by factor of 1.4 [1.15-1.5] (T Pechacek, Austin team). • High-quality primary care, through referral and prescription, increases usage of SQ services & products by a factor of 1.4 [1.15-1.5] compared with no or mediocre primary care (T Pechacek, Austin team).
Secondhand smoke (SHS) • Prevalence of significant SHS exposure at home, at work, in public places based on Mowery 2007 (unpublished analysis of cotinine levels in NHANES 1999-2002) & CDC Fact Sheet on SHS • Fraction of workplaces with smoking ban from Surgeon General Report 2006 for 1992-2001; and 2003 value from S Babb (CDC). • Relative risks of SHS for CV events based on Surgeon General Report: CHD event 1.27, Stroke 1.04, Any CV event 1.14
Air pollution • Particulate matter (PM2.5) mcg/meter3 1990-2003 annual means from Dominici AJ Epi 2007 • Comparing mortality data from Pope Circ 2004 and Surgeon General Report 2006, estimate that increase of 15 mcg/meter3 in PM2.5 is equivalent to SHS exposure.
Psychosocial stress • Stress may result from poverty, crime, racial discrimination, or other persistent difficulties at work or in one’s personal life. • Our model proxy for stress is BRFSS “only sometimes/rarely/never get the social or emotional support I need”; US 2005-06 average 21%. • Social supports may mitigate the impact of chronic stressors. In line with the BRFSS metric, our input “sources of stress” variable is net of such mitigating social supports.
Impact of mental health services • Mental health services can reduce stress; estimate multiplier of 0.7 [0.6-0.8] (Austin team).
Mental health services • We estimate 25% [15%-35%] of the highly stressed in the US have access to (can afford) MH services (including psychologists and social workers), and 33% [20%-50%] of those with access utilize them (Austin team). • Together this gives 8.3% baseline estimate of utilization by the highly stressed, which accords with a separate estimate we have done based on the number of MH workers in the US. • Media promotion of MH services could increase usage by factor of 1.2 [1.0-1.3] (Austin team). • High-quality primary care, through referral, increases usage of MH services by factor of 1.7 [1.2-2.2] compared with no or mediocre primary care (Austin team).
Stress to smoking • Stress multiplier on smoking relapse 1.25 [1.1-1.35]. (Austin team) • Stress multiplier on smoking quits 0.7 [0.5-0.8]. (Austin team and Terry P)
Stress to high blood pressure • Stress can lead to elevated blood pressure (Rozanski et al, Circ 1999). • Estimate stress multiplier on high BP onset 1.5 [1.25-1.75]. (Austin team)
Stress to obesity • “Stress eating” can increase the risk of becoming obese (Bjorntorp, Obesity Reviews 2001) • Estimate RR=1.6 [1.2-2.0] for becoming obese due to stress (Austin team)
Physical activity • We define adequate PA as doing vigorous activity at least once a week. BRFSS US 2004-06 indicates 49% do adequate PA. • We estimate 70% in the US have access to safe and affordable PA (Travis County BRFSS indicates 67% of neighborhoods safe and 71.5% have sidewalks). Together with 49% doing adequate PA, this implies 70% of those with access do adequate PA. • Social marketing of PA could reduce prevalence of inadequate PA; estimate multiplier of 0.78 [0.69-0.9] (D Buchner, Austin team).
PA to chronic disorders • Inadequate Physical Activity increases onset of high BP; estimate Relative risk 1.15 [1.15-1.4] (Paffenberger Ann Med-Helsinki 1991, Haapanen Intl J Epi 1997, Katzmarzyk CMAJ 2000). • Inadequate Physical Activity increases onset of high cholesterol; estimate Relative risk 1.4 [1.3-1.5] (CDC PA branch epidemiologist). • Inadequate Physical Activity increases onset of diabetes; estimate Relative risk 1.4 (Haapanen Int J Epi 1997, Manson Lancet 1991, Hu Arch Int Med 2001, Katzmarzyk CMAJ 2000).
PA to stress • Physical activity can reduce stress (Surgeon General Report on PA and Health 1996; Fleshner, Exerc Sport Sci Rev 2005). • Estimate multiplier of 1.3 [1.25-1.35] from D Buchner.
Junk food taxes & sales restrictions • Junk food taxes may reduce the prevalence of poor diet, but their effect is likely to be much less than the effect of tobacco taxes on smoking (D Galuska). Estimate RR 0.95 [0.9-1] (Austin team).
Healthy diet • We define a healthy diet as meeting dietary recommendations per the 10 dimensions in the USDA’s Healthy Eating Index. Averaging across these components, only 36% of Americans in 2000 had a diet which was healthy. • We estimate 70% in the US have access to and can afford a healthy diet. (In East Travis County BRFSS, 37% say cost is a deterrent to eating fresh fruits and vegetables.) Together with the 36% healthy diet fraction, this implies 52% of those with access take advantage and have a healthy diet. • Social marketing could reduce the prevalence of unhealthy diet; estimate multiplier of 0.86 [0.82-.9] (D Buchner, Austin team).
Diet to chronic disorders • Unhealthy diet (particularly excess sodium) increases onset of high BP; estimate Relative risk 1.15 [1.15-1.4] (Elmer, Ann Int Med 2006–DASH/PREMIER study). • Unhealthy diet (particularly excess saturated fats) increases onset of high cholesterol; estimate Relative risk 1.5 [1.3-1.7] (Beauchesne-Rondeau, AJCN 2003; Djousse, AJCN 2004, and compare with physical activity impact in Leon and Sanchez Med Sci Sports Exerc 2001).
Cost of risk factor complications • All costs are in 2005 dollars. • Post-CVD one-year medical costs and sick days; (Russell et al 1998; flack et al 2002; Sasser et all 2005). • Non-CVD one-year inpatient costs and sick days attributable to risk factors estimated by regression analysis; (RTI analysis of linked MEPS and NHIS files for 2000-2003). • Year of life lost per CV death; (Social Security actuarial life table). • Non-CV death rates and years of life lost for diabetes, obesity, and smoking; (ADA/Lewin Group, Diabetes Care 2003; WHO website for 2004, Clausen & Jensen, J Human Hypertension 1992; Flegal et al, JAMA 2007; SAMMEC/CDC website). • Productivity cost per lost day; (Haddix, Teutsch, Corse, Prevention Effectiveness, 2003). Other Costs
Cost of risk factor management • Costs of prescription drugs and physician office visits for smokers and those with high BP, high Cholesterol, and diabetes; (RTI regression analysis of linked MEPS and NHIS files for 2000-2003; ADA/Lewin Group, Diabetes Care 2003). • Relative costs for high-quality intensive management for chronic disorders; Costs of smoking quit services and products; (Herman et al, RTI/CDC, “A Markov model of disease progression and cost-effectiveness for Type 2 Diabetes” technical report 2005). • Cost estimates for weight loss services based on Weight Watchers and gym membership costs. • Estimates of mental health services costs based on typical session fees for psychologists and social worker. • All costs are in 2005 dollars.