Download
1 / 43
460 likes | 958 Vues
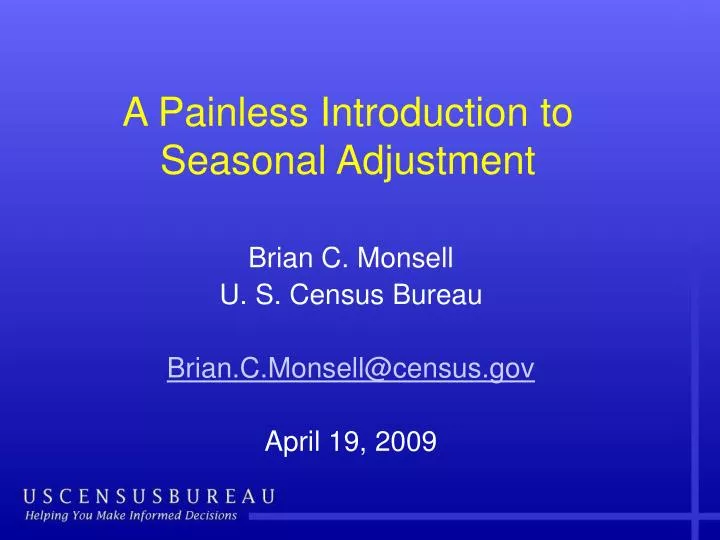
A Painless Introduction to Seasonal Adjustment. Brian C. Monsell U. S. Census Bureau Brian.C.Monsell@census.gov April 19, 2009. Outline. Review some basic concepts Definitions of components Current methods and software Future Developments. What is a time series?.

E N D
A Painless Introduction to Seasonal Adjustment Brian C. Monsell U. S. Census Bureau Brian.C.Monsell@census.gov April 19, 2009
Outline • Review some basic concepts • Definitions of components • Current methods and software • Future Developments
What is a time series? • In economics, we usually define time series as “a set of values of a variable collected at a regular interval” • Time series are correlated observations over time
Purpose of seasonal adjustment • Bell and Hillmer (1984) • “Seasonal adjustment is done to simplify the data so that they may be more easily interpreted … without a significant loss of information” • Large seasonal movements can obscure other movements of importance. • Easier to see related movements in different series
Background:Components of a Time Series • Y = C x S x I (or C + S + I) where • Y = Original series • C = Trend-cycle • S = Seasonal effects (+ other effects) • I = Irregular
Trend-Cycle • Level of the series • Local level estimates for the purpose of estimating seasonal factors • Reasonably smooth, includes movements and cycles that last longer than a year • Find turning points in the trend
Seasonal Effects • Reasonably stable in terms of • Annual timing • Within same month or quarter • Direction • Magnitude
Irregular Effects • Unpredictable in terms of • Timing • Impact • Duration • Residual after removing seasonal and trend
Types of Decompositions Yt Original series Ct Trend-Cycle component St Seasonal component It Irregular component
Calendar Effects • Trading or Working Day: • Effects related to: • Which weekdays (Mondays,…, Sundays) occur five times in a month • Effects of variable length of February.
August 2007 Sun Mon Tue Wed Thu Fri Sat 1 2 3 4 5 6 7 8 9 10 11 12 13 14 15 16 17 18 19 20 21 22 23 24 25 26 27 28 29 30 31
August 2008 Sun Mon Tue Wed Thu Fri Sat 1 2 3 4 5 6 7 8 9 10 11 12 13 14 15 16 17 18 19 20 21 22 23 24 25 26 27 28 29 30 31
Calendar Effects (Continued) • Moving Holidays: • Effects of holidays • With changing dates • Which can impact more that one month in a way that depends on the date. • Examples : Easter, Chinese New Year, Ramadan, etc
Current methods (and software) for seasonal adjustment • Non-parametric methods • The X-11 family (U. S. Census Bureau, Statistics Canada) • SABL (Bell Labs) • STL (Seasonal-Trend Loess – Bell Labs) • Parametric (model-based) methods • TRAMO/SEATS (Bank of Spain) • STAMP (Andrew Harvey)
“X-11” Family X-11 X-11-ARIMA X-12-ARIMA X-13-ARIMA-SEATS
X-11 (US Census) • Shiskin, Young, and Musgrave (1967) • First computerized seasonal adjustment program (X=eXperimental) • Features include: • Treatment of extreme values (robustness) • Trading day effect estimation • Variety of moving averages for estimating evolving seasonal patterns and trends • One-sided moving averages for the ends of the series
Problems with X-11? • Low quality of the asymmetric filters at the ends of the time series • Limited filter choices
X-11-ARIMA • Developed by Estella Dagum and her team at Statistics Canada (1980, 1988, 2000) • Advances include: • ARIMA Forecast extension • Reduces Revisions • Improves quality of the end adjustments • Quality diagnostics for seasonal adjustment • Comparison of Direct vrs. Indirect Adjustment of Aggregate Series
Main Limitations • No user-defined regressors for special situations • ARIMA modeling not robust against outliers • Seasonal adjustment not robust against level shifts
Level Shift Level shift at t0 LS regressor – 1 for t < t0 0 for t t0
X-12-ARIMA • Developed at the Census Bureau – Findley, Monsell, Bell and Otto (1990) • Current method for statistical agencies in United States, UK, Canada, New Zealand, Japan, and other countries
Features of X-12-ARIMA • Wide variety of seasonal and trend filter options; • Suite of modeling and seasonal adjustment diagnostics, including • Spectral diagnostics; • Diagnostics of the quality and stability of the seasonal adjustments; • Out of sample forecast error model selection diagnostics.
Features of X-12-ARIMA • Extensive time series modeling and model selection capabilities • linear regression models with ARIMA errors (regARIMA models); • Automatic model selection options; • User-defined regression variables.
RegARIMA Model transformation ARIMA Process Regressor for trading day and holiday or calendar effects, additive outliers, temporary changes, level shifts, ramps, user-defined effects Leap-year adjustment, or “subjective” strike adjustment, etc.
Uses of RegARIMA Models in X-12-ARIMA • Forecast (and Backcast) extension of series before applying X-11 filters • Detect and adjust for outliers and other distorting effects to improve the forecasts and seasonal adjustments (automatic option) • Detect and estimate additional components (e.g. calendar effects)
Model Based (Parametric) Seasonal Adjustment Methods • TRAMO/SEATS • Developed at the Bank of Spain by Victor Gomez and Agustin Maravall (1996) • Uses ARIMA model as basis for seasonal decomposition
Airline Model – ARIMA(0 1 1)(0 1 1) (1 - B)(1 – B12) zt = (1 - B)(1 - 12B12) at • Can infer • A model for the seasonality from seasonal MA term • A model for the trend from the nonseasonal MA term • Hillmer and Tiao (1978)
TRAMO/SEATS (Bank of Spain) • Consists of two linked programs • TRAMO is a complete regARIMA modeling package, with automatic identification of ARIMA models, outliers and other components • SEATS takes modeling results from TRAMO and performs a model-based signal extraction • Used by European statistical agencies
Advantages of SEATS • The adjustment filter is determined by a model, not a finite set of moving average filters. • In practice, SEATS sometimes gives smoother adjustments with smaller revisions for some irregular Census Bureau series
What’s Next? X-13ARIMA-SEATS = X-13A-S = X-12-ARIMA + SEATS
What is X-13A-S? • Users can choose between model-based seasonal adjustments from SEATS and non-parametric adjustments with X-11. • Collaboration between the U. S. Census Bureau and the current developers of SEATS, Agustin Maravall of the Bank of Spain and Gianluca Caporello.
Why X-13A-S? • Allows users to • generate X-11 and SEATS seasonal adjustments using the same interface • compare X-11 and SEATS seasonal adjustments using a common set of diagnostics
Contact Information brian.c.monsell@census.gov Brian Monsell U.S. Census Bureau SRD, Room 5K018 Washington DC 20233
For more information about X-11 “Seasonal Adjustment with the X-11 Method”, by Dominique Ladiray and Benoît Quenneville (2001), Springer
TRAMO/SEATS • Bank of Spain website www.bde.es/servicio/software/econome.htm
X-12-ARIMA Web Site X-12 Download Site www.census.gov/srd/www/x12a OR • Access www.census.gov • Choose “A to Z Index” • Choose “X” • Link to X-12-ARIMA Website