Download
1 / 55
580 likes | 802 Vues
Module 2 Current State Analysis. Welcome!. Agenda for all 5. Review of Module 1. You can now:- Understand the principles of lean Appreciate the need to remove wastes and failure demand Analyse who your customers are, what they need from you and how they feel about your service.

E N D
Review of Module 1 You can now:- • Understand the principles of lean • Appreciate the need to remove wastes and failure demand • Analyse who your customers are, what they need from you and how they feel about your service
Lets Review Your Homework • Talk to your Customer • Complete the Project Documentation
Agenda • Plan Do Check Act and A3 • Current state mapping, why, how and tips • The importance of Gemba • Root cause analysis
You Should… Be able to:- • Understand the importance of mapping • Be able to create a current state map • Want to actively adopt Gemba • Have options for root cause analysis
Put plans in place to standardise the process & set further review dates Investigate the current situation & understand fully the nature of the problem to be solved • Plan • Act • Do • Check Develop a future state. Implement short term fixes and long term plans to eliminate root causes Evaluate the effect of implementation; have actions delivered expected results?
Put plans in place to standardise the process & set further review dates Investigate the current situation & understand fully the nature of the problem to be solved • Plan • Act • Do • Check Develop a future state. Implement short term fixes and long term plans to eliminate root causes Evaluate the effect of implementation; have actions delivered expected results?
A3 is Aligned to PDCA Plan Do Check Act
Plan – Prioritise Improvements • Plan • Act • Do • Check
Problem Statements • A clear statement that describes the symptoms of the problem, the boundaries and reason for review. A good problem statement: • Has a desired state or goal • Contains measurement • Is short and to the point • Has no implied cause or solution • Is limited in scope
Good Problem Statements • It takes 7 weeks to process an expenses form – staff would like payment within 1 week • The cost of replacing damaged lab equipment is excessive – we need to reduce this by 50% • Returned library books take days to go back on shelves. We want books on shelves within 5 hours • Our department wastes too much time searching for information. We need to be able to find a file on the shared drive within 45 seconds
Develop Problem Statements For Your Work Area
What is a Process? • Everything that happens within the University is a process or a series of processes • A process may be contained within one department or may be cross- functional or university wide • Our success is determined by how well these processes work and work together
What is a Process Map? • A visual picture of everything that happens • Common understanding • Understanding outside of your immediate area • Issues clearly highlighted • Symptom and cause • Drawn by the people who do the job • Realisation • Buy-in to change • Management tool • Make decisions now and in the future
Lean and Mapping CURRENT STATE FUTURE STATE FUTURE STATE FUTURE STATE IDEAL STATE 21
Why Map the Current Process? • Understanding - gives an overall picture of the end to end process including all activities and decisions and highlighting complexities. • Analysis – When all the activities are clearly visible it is easier to see the problems, errors and wastes. It directs improvement efforts to the right areas. • Communication – The act of creating the map helps to bring the team together and provides a common language. It allows for plenty of discussion • Customer Focus - details how we are meeting customer requirements . . . Or not!!
How to Map Current State Identify Your Process Establish a Process Team • We need people who: • Are enthusiastic and interested • Are honest and open • Believe that there is room for improvement • Play a key role in the current process
How to Map Current State Establish the Environment • Sensitivities need to be acknowledged • Set rules • Location • Empowerment – Senior endorsement • Engage with everyone Set the Boundaries of the Process Determine the Appropriate Level of Detail
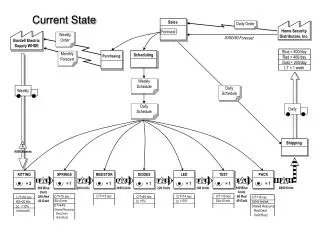
How to Map Current State ownership process steps timeline issues OPTIMISM Identify the Activities – Post-its on a big sheet of brown paper. Visually capture a process from end to end on one piece of paper Muda inputs & outputs suggestions measures 25
Questions to AskWhen Process Mapping • What triggers the process? • What are the inputs? • What is the next step? • What are the outputs? • How is information forwarded? (hardcopy, email, system updated) • How many people undertake this step? • How long does this step take? • What is the time delay between steps? • What are the issues?
How Do We Do It Now? Issues Process
Remember Current State Maps are the team’s PERCEPTION of what happens within the process Map is produced from comments of those in session so will also need to get comments from outside We then need to go CHECK THE FACTS 35
Gemba Gemba = The Real Place
Why do Gemba walks? • Managers become more accessible - barriers to speak with them are lowered • Management understands what is actually happening and why - seeing not just analysing data (disconnect between understanding & decision making) • Management can visibly support change efforts -actively supporting not just empowering • Develops a culture of trust - people should not be surprised to see you
Gemba Rules • Show respect, know who people are • Explain to people what you have come to see • Build trust – gemba walks should be common place • Don’t be afraid to ask why (not why don’t you..?) • The objective of Gemba Walk is to understand the value stream and its problems rather than review results or make superficial comments. Gemba is not a pat on the back exercise , it’s going to the actual place to see the actual work in actual time. http://www.youtube.com/watch?v=2jL5EUtiTJ4
A3 – Business School Plan Root Cause Analysis
Problem Solving Problem solving is like pulling weeds…. Unless we address the root that causes the problem, poor results will keep coming back.
Root Cause Analysis (RCA) • Root Cause Analysis seeks to identify the primary cause of a problem so that you can: • Determine what happened? • Determine why it happened? • Figure out what to do to reduce the likelihood of it happening again
Root Cause Analysis • Define the problem • Gather evidence • Identify all causal factors • Identify the root cause using RCA tools e.g. 5 whys, Pareto charts, fishbone diagrams etc • Identify solutions • Implement • Observe • Continuously improve
5 Whys Why? Why? Why? Why? Why?
“The staff in the Exams and Assessment office are not getting the marks to students on time” • Why?Because the marks are late into the office from the lecturers Why?Because the timescales are too tight Why?Because there are just too many exam papers to mark Why? There are too many courses / modules Why?Because we keep adding new modules but don’t switchany off! Conclusion: A strategic decision needs to be taken on the number of modules on offer.
Ishikawa aka cause and effect analysis and fishbone analysis • Helps identify root causes of a problem • Encourages group participation & utilises group knowledge • Easy to understand • Identifies areas for further data collection
Ishikawa Identify all the factors Problem statement Identify all causes Identify root cause
Fishbone/Ishikawa Method Machinery Manpower Temp. staff wasn’t properly trained No policy exists about how to issue marks or what happens when it goes wrong Recoding system makes it easy to get a whole batch of marks wrong Exam officer on sick leave Wrong marks issued to students Phone rings all time Frequent student requests Manager not given financial budget to allocate staff training Environment Materials
Identify root cause Problem statement Factor
Measles Chart • A map, picture or form with a rash of dots to identify problem areas. To complete: • Get a copy of form or process where problems are occurring • Agree timescales for recording problem • Mark the location of each problem on the form / diagram as it occurs • Identify where problems are clustered • Use the measles chart to inform improvement activities
Measles Chart Example • Issue – incomplete forms returned to Staff development. • Using a blank form the team recorded the areas of missing information • At the end of the month the main problem areas were identified and action taken
A3 – Business School Plan