Download
1 / 25
280 likes | 563 Vues
UNIVERSITY OF MARYLAND AT COLLEGE PARK. Trapping and destruction of long range high intensity optical/plasma filaments by molecular quantum wakes. S. Varma, Y.-H. Chen, and H. M. Milchberg Institute for Research in Electronics and Applied Physics Dept. of Electrical and Computer Engineering

E N D
UNIVERSITY OF MARYLAND AT COLLEGE PARK Trapping and destruction of long range high intensity optical/plasma filaments by molecular quantum wakes S. Varma, Y.-H. Chen, and H. M. Milchberg Institute for Research in Electronics and Applied Physics Dept. of Electrical and Computer Engineering Dept. of Physics Support: DoE, NSF, JHU-APL HEDLP - 2008
Some applications of filaments • directed energy • triggering and guiding of lightening • remote detection: LIDAR, LIBS • directed, remote THz generation
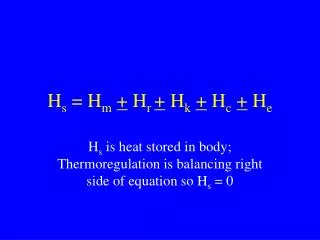
High power, femtosecond laser beams propagating through air form extremely long filaments due to nonlinear self-focusing ((3)) dynamically balanced by ionization and defocusing. Introduction to Filamentation 0 neff = n0 + ngas + nplasma Pcr ~ 2/8n0n2
Filament images at increasing power (Pcr occurs at 1.25 mJ for a 130fs pulse) What does a filament look like? 5 mm 0.8Pcr 1.3Pcr 1.8Pcr 2.3Pcr 2.8Pcr 3.5 mJ
Delayed inertial response + + + + + + + + + + - - - - - - - - - - Molecules: 78% nitrogen, 21% oxygen “prompt” and “delayed” optical response of air constituents Prompt electronic response + + + + + Laser polarization - - - - - Atoms: 1% argon
Classical picture molecular axis induced dipole moment • laser field applies a net • torque to the molecule • -molecular axis aligns along • the E field • delayed response (ps) • due to inertia intense laser field (~1013 W/cm2) time-dependent refractive index shift random orientation “some” alignment degree of alignment < >t : time-dependent ensemble average n0=n(random orientation) Laser field alignment of linear gas molecules
Quantum description of rigid rotor even (“rotational constant”) (j: ≥0 integer) where : moment of inertia Rotational wavepacket An intense fs laser pulse “locks” the relative phases of the rotational states in the wavepacket Field alignment and “revivals” of rotational wavepacket eigenstate
Quantum revival of rotational response The time-delayed nonlinear response is composed of many quantized rotational excitations which coherently beat. t = Tbeat t = 0 We can expect the index of refraction to be maximally disturbed at each beat.
Single-shot Supercontinuum Spectral Interferometry (SSSI) – Imagine a streak camera with 10fs resolution! A pump pulse generates transient refractive index n (r, t) x Imaging lens Pump pulse z Probe Ref. Probe Ref. Imaging spectrometer CCD medium y • Probe and Ref. • Temporally stretched (chirp) for long temporal field of view (~ 2 ps). • ~100 nm bandwidth supercontinuum gives ~10 fs resolution. Extract probe (x, t) to obtain n(x, t).
Experimental setup and sample interferogram 0 ps ~ 2 ps Sample interferogram N2O gas 250 mm 652nm 723nm Chen, Varma, York and Milchberg, Opt. Express 15, 11341 (2007)
Rotational wavepacket of D2 and H2 molecules P=7.8 atm I=4.4x10¹³ W/cm2 room temperature
Rotational quantum “wakes” in air TN2 , ¾TO2 Vg pump vg pump SSSI measurement showing alignment and anti-alignment “wake” traveling at the group velocity of the pump pulse.
2m filament f/300 focusing Object plane Polarizing beamsplitter CCD Pump-probe filament experiment
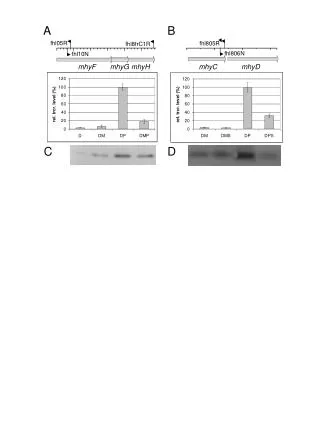
TN2 , ¾TO2 B A 5 mm C D (ps) (ps) 8.4 8.0 8.8 8.0 8.8 8.4 Filaments are trapped/enhanced or destroyed
Both beams collinear, probe filament coincident with alignment wake of N2 and O2 in air CCD camera saturation Trapped filaments are ENHANCED White light generation, filament length and spectral broadening are enhanced. Aligning filament (left) and probing filament (right), misaligned
Conclusions • SSSI enables us to probe refractive index transients with ~10fs resolution over 2ps in a single shot, allowing us to observe room-temperature molecular alignment. • A high intensity laser filament propagating in the quantum wake of molecular alignment can be controllably and stably trapped and enhanced, or destroyed. • Applications: directed energy, remote sensing, etc...
Pump power scan(probe=3.4Pcr) 0.68Pcr 1.12Pcr Increasing aligning pulse energy 1.72Pcr 2.20Pcr 2.60Pcr 3.72Pcr (ps) Response near t=0 A laser A (ps)
Spectral broadening The spatio-temporally varying refractive index of the wake of molecular alignment causes predictable spectral modulation and broadening of the probe filament. Filament spectrum v. delay Alignment v. delay B D A C E C E A D B
T=8.2ps T/2 3T/4 Example: N2 T/4 nitrogen ps peak width ≈T / jmax(jmax+1) ~ 40 fs for N2 Molecular rotational wavepacket revivals mode-locking analogy: coherent sum of longitudinal modes typ. spectrum modes pulse width ≈ (round trip time) / (# of modes)
1D spatially resolved temporal evolution of O2 alignment • pump peak intensity: • 2.7x10¹³ W/cm2 0.5T 0T 0.25T • 5.1 atm O2 at room temperature • T=11.6 ps x (mm) (fs) 0.75T 1T 1.25T x (mm) (ps)
High power, femtosecond laser beams that propagate through air form extremely long filaments due to nonlinear self-focusing ((3)) dynamically balanced by ionization and defocusing. Filaments can propagate through air up to 100s of meters, and are useful for remote excitation, ionization and sensing. Introduction to Filamentation
=61.8 cm1 T=270 fs T 0.3010-24cm3 Rotational wavepacket of H2 molecules at room temperature Experiment: Fourier transform Lineout at x=0 Calculation: • The pump intensity bandwidth (~2.5x10¹³ s-1) is even less adequate than in D2 to populate j=2 and j=0 states. • Weaker rotational wavepacket amplitude. P=7.8 atm I=4.4x10¹³ W/cm2
Charge density wave in N2 at 1 atm • Filament ionization fraction ~10-3 2x1016 cm3 • ~0.5% ponderomotive charge separation at enhanced intensity ~5x10¹⁴ W/cm2 over 50-100 fs alignment transient Ne~ 1014 cm-3 E~ 0.75 MV/cm • Many meters of propagation “probe” pulse vg -- + Quantum beat index bucket
Experimental setup and sample interferogram 110 fs high pressure exp gas cell 1 kHz Ti:Sapphire regenerative amplifier (up to ~8 atm) P: pinhole BS: beamsplitter HWP: l/2 plate SF4: dispersive material ~300 mJ xenon gas cell (1-2 atm) supercontinuum (SC) Michelson interferometer • Optical Kerr effect (c(3)) and the molecular rotational response in the gas induce spectral phase shift and amplitude modulation on the interferogram. 0 ps ~ 2 ps Sample interferogram N2O gas • Both spectral phase and amplitude information are required to extract the temporal phase (refractive index). 250 mm 652nm 723nm
Experimental setup and sample interferogram 110 fs high pressure exp gas cell 1 kHz Ti:Sapphire regenerative amplifier (up to ~8 atm) P: pinhole BS: beamsplitter HWP: l/2 plate SF4: dispersive material ~300 mJ xenon gas cell (1-2 atm) supercontinuum (SC) Michelson interferometer • Optical Kerr effect (c(3)) and the molecular rotational response in the gas induce spectral phase shift and amplitude modulation on the interferogram. 0 ps ~ 2 ps Sample interferogram N2O gas • Both spectral phase and amplitude information are required to extract the temporal phase (refractive index). 250 mm 652nm 723nm