Download
1 / 2
20 likes | 154 Vues
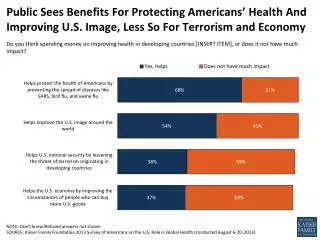
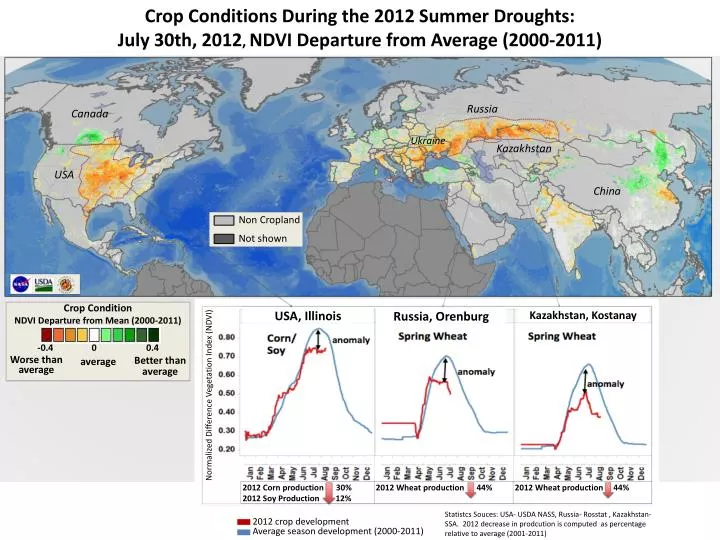
Crop Conditions During the 2012 Summer Droughts: July 30th, 2012 , NDVI Departure from Average ( 2000-2011). 2012 Wheat production 44 %. 2012 Corn production 30% 2012 Soy Production 12%. Russia. Canada. Ukraine. Kazakhstan. USA. China. Non Cropland

E N D
Crop Conditions During the 2012 Summer Droughts: July 30th, 2012, NDVI Departure from Average (2000-2011) 2012 Wheat production 44% 2012 Corn production 30% 2012 Soy Production 12% Russia Canada Ukraine Kazakhstan USA China Non Cropland Not shown USA, Illinois Kazakhstan, Kostanay Russia, Orenburg Crop Condition NDVI Departure from Mean (2000-2011) Crop NDVI Anomaly -0.4 0 0.4 -0.4 0 0.4 2012 Wheat production 44% average Worse than average Better than average normal Better than normal 2012 crop development Average season development (2000-2011) Normalized Difference Vegetation Index (NDVI) StatistcsSouces: USA- USDA NASS, Russia- Rosstat , Kazakhstan- SSA. 2012 decrease in prodcution is computed as percentage relative to average (2001-2011) (Data source: NASA MODIS) processed at UMD
Crop Conditions During the 2012 Summer Droughts: July 30th, 2012, NDVI Departure from Average (2000-2011) 2012 Wheat production 44% 2012 Corn production 30% 2012 Soy Production 12% Russia Canada Ukraine Kazakhstan USA China Non Cropland Not shown USA, Illinois Kazakhstan, Kostanay Russia, Orenburg Crop Condition NDVI Departure from Mean (2000-2011) Crop NDVI Anomaly -0.4 0 0.4 -0.4 0 0.4 2012 Wheat production 44% average Worse than average Better than average normal Better than normal 2012 crop development Average season development (2000-2011) Normalized Difference Vegetation Index (NDVI) StatistcsSouces: USA- USDA NASS, Russia- Rosstat , Kazakhstan- SSA. 2012 decrease in prodcution is computed as percentage relative to average (2001-2011) (Data source: NASA MODIS) processed at UMD