Download
1 / 51
510 likes | 628 Vues
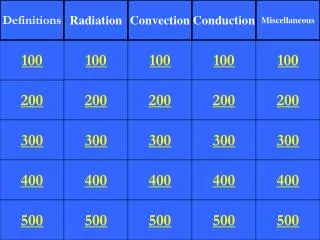
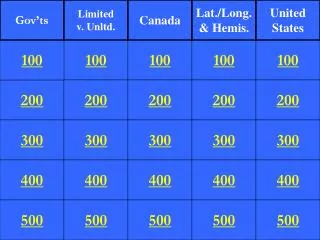
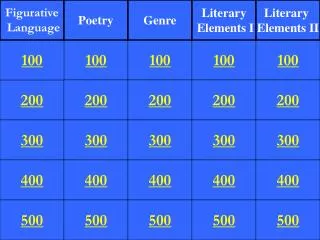
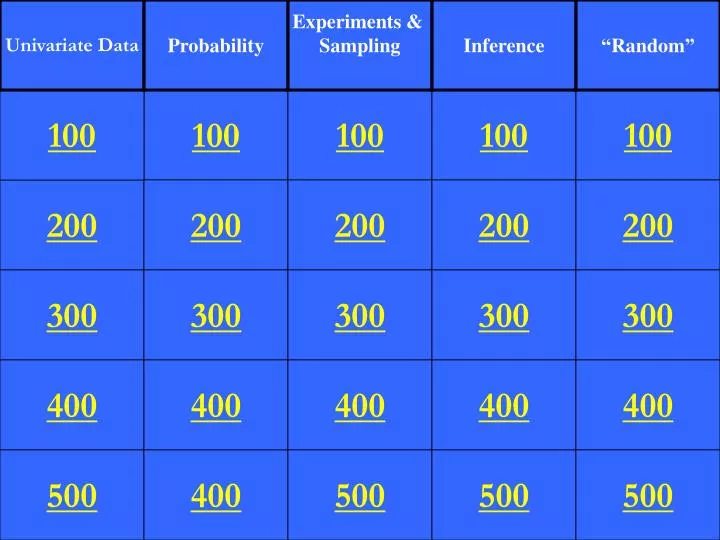
Univariate Data. Probability. Experiments & Sampling. Inference. “ Random ”. 100. 100. 100. 100. 100. 200. 200. 200. 200. 200. 300. 300. 300. 300. 300. 400. 400. 400. 400. 400. 500. 400. 500. 500. 500. 100 Points. 100 Points. Univariate Data.

E N D
Univariate Data Probability Experiments & Sampling Inference “Random” 100 100 100 100 100 200 200 200 200 200 300 300 300 300 300 400 400 400 400 400 500 400 500 500 500
100 Points 100 Points Univariate Data A distribution that has a mean significantly greater than the median would most likely ____________________ • Symmetric • Skewed Right • Skewed Left • Bimodal • Uniform 1:44 1:55 1:54 1:53 1:45 1:49 1:46 1:52 1:50 1:19 1:43 1:42 1:41 1:40 0:33 0:19 1:09 0:58 1:11 1:56 1:51 1:39 1:38 1:37 1:36 1:35 1:32 1:15 1:29 1:28 1:27 1:24 1:21 1:01 1:16 0:31 1:14 1:13 1:18 1:12 1:30 0:30 1:33 1:08 0:24 0:53 0:50 0:41 0:40 0:47 0:45 1:58 0:39 0:56 1:02 1:03 1:04 1:06 0:44 0:55 0:20 0:37 0:16 0:13 0:11 0:18 0:08 0:06 0:35 0:38 0:21 0:09 1:48 1:47 1:20 1:26 1:25 0:46 0:43 1:23 1:17 1:22 0:42 1:59 1:00 0:59 1:10 1:31 0:32 0:27 2:00 0:29 0:28 0:48 0:36 0:49 0:10 0:51 0:57 0:22 1:05 0:17 0:15 0:14 0:12 0:52 1:07 0:07 1:57 0:05 0:04 0:03 0:02 0:01 End 0:23 1:34 0:25 0:26 0:54 0:34
200 Points 200 Points Univariate Data Which of the following is most resistant to outliers? • Standard Deviation • Variance • Mean • Median • Range 1:44 1:55 1:54 1:53 1:45 1:49 1:46 1:52 1:50 1:19 1:43 1:42 1:41 1:40 0:35 0:38 1:08 0:58 1:18 1:24 1:27 1:28 1:29 1:51 1:21 1:56 1:30 1:13 1:09 1:39 1:32 1:33 1:16 1:15 1:14 0:33 1:12 1:35 1:11 1:36 1:37 0:31 1:38 1:06 0:30 0:50 0:45 0:41 0:53 0:47 1:58 0:56 0:40 1:01 1:02 1:03 1:04 0:55 0:44 0:39 0:21 0:19 0:18 0:16 0:13 0:20 0:09 0:08 0:06 0:24 0:37 0:11 1:48 1:47 1:22 0:48 0:49 0:54 0:52 1:20 0:46 1:17 0:51 1:23 0:34 0:42 1:25 1:26 0:36 0:27 0:32 0:29 0:28 0:57 0:43 1:59 0:07 1:05 0:25 0:17 0:22 1:10 0:14 0:12 0:23 0:10 1:57 0:05 0:04 0:03 0:02 0:01 End 2:00 0:15 1:34 1:31 0:26 1:07 0:59 1:00
300 Points 300 Points Univariate Data Wieland tells you that your quiz grade was the 90th percentile. If the mean and standard deviation were 77 and 8 respectively, what was your grade? • 87 • 90 • 92 • 94 • 97 1:44 1:55 1:54 1:53 1:49 1:46 1:45 1:43 1:19 1:42 1:50 1:41 1:52 1:40 1:14 1:56 1:51 1:39 1:38 1:37 1:36 1:35 1:33 1:32 0:30 1:13 1:30 0:33 1:15 1:16 0:06 1:18 1:28 1:21 0:18 0:35 1:24 0:31 0:21 0:19 1:27 0:24 1:29 0:44 1:58 1:02 1:04 0:37 1:03 0:09 1:12 0:08 0:11 1:08 1:09 0:20 1:06 0:58 1:01 0:39 0:45 0:47 0:16 0:40 0:50 0:41 0:13 0:53 0:38 0:56 0:55 1:11 1:48 1:47 0:59 0:26 1:59 1:17 1:07 1:10 0:52 1:20 1:05 0:51 0:36 0:48 0:46 0:43 0:42 0:28 0:34 0:32 0:29 1:22 0:49 1:23 0:07 1:26 0:54 0:23 0:22 1:57 0:15 0:14 0:12 0:10 0:05 0:04 0:03 0:02 0:01 End 2:00 0:17 0:25 0:57 0:27 1:34 1:31 1:25 1:00
400 Points 400 Points Univariate Data Using the dataset, calculate the mean and standard deviation. {3, 8, 10, 3, 12, 10} • (7.5, 3.5) • (7.6, 3.5) • (7.6, 12.3) • (7.6, 4.0) • (8.0, 4.0) 1:44 1:55 1:54 1:53 1:49 1:46 1:45 1:43 1:19 1:42 1:50 1:41 1:52 1:40 1:14 1:56 1:51 1:39 1:38 1:37 1:36 1:35 1:33 1:32 0:30 1:13 1:30 0:33 1:15 1:16 0:06 1:18 1:28 1:21 0:18 0:35 1:24 0:31 0:21 0:19 1:27 0:24 1:29 0:44 1:58 1:02 1:04 0:37 1:03 0:09 1:12 0:08 0:11 1:08 1:09 0:20 1:06 0:58 1:01 0:39 0:45 0:47 0:16 0:40 0:50 0:41 0:13 0:53 0:38 0:56 0:55 1:11 1:48 1:47 0:59 0:26 1:59 1:17 1:07 1:10 0:52 1:20 1:05 0:51 0:36 0:48 0:46 0:43 0:42 0:28 0:34 0:32 0:29 1:22 0:49 1:23 0:07 1:26 0:54 0:23 0:22 1:57 0:15 0:14 0:12 0:10 0:05 0:04 0:03 0:02 0:01 End 2:00 0:17 0:25 0:57 0:27 1:34 1:31 1:25 1:00
500 Points 500 Points Univariate Data • Which of the statements is true about standard deviation? • It depends on the mean • It is a measure of spread • It is not resistant to outliers • I & II • I & III • II & III • I, II, & III • None 1:44 1:55 1:54 1:53 1:49 1:46 1:45 1:43 1:19 1:42 1:50 1:41 1:52 1:40 1:14 1:56 1:51 1:39 1:38 1:37 1:36 1:35 1:33 1:32 0:30 1:13 1:30 0:33 1:15 1:16 0:06 1:18 1:28 1:21 0:18 0:35 1:24 0:31 0:21 0:19 1:27 0:24 1:29 0:44 1:58 1:02 1:04 0:37 1:03 0:09 1:12 0:08 0:11 1:08 1:09 0:20 1:06 0:58 1:01 0:39 0:45 0:47 0:16 0:40 0:50 0:41 0:13 0:53 0:38 0:56 0:55 1:11 1:48 1:47 0:59 0:26 1:59 1:17 1:07 1:10 0:52 1:20 1:05 0:51 0:36 0:48 0:46 0:43 0:42 0:28 0:34 0:32 0:29 1:22 0:49 1:23 0:07 1:26 0:54 0:23 0:22 1:57 0:15 0:14 0:12 0:10 0:05 0:04 0:03 0:02 0:01 End 2:00 0:17 0:25 0:57 0:27 1:34 1:31 1:25 1:00
100 Points 100 Points Probability The probability of Jason serving an ace in tennis is 0.15, and the probability that he double faults is 0.25. What is the probability that he doesn’t serve an ace or double fault? • 0.4 • 0.45 • 0.5 • 0.55 • 0.6 1:44 1:55 1:54 1:53 1:49 1:46 1:45 1:43 1:19 1:42 1:50 1:41 1:52 1:40 1:14 1:56 1:51 1:39 1:38 1:37 1:36 1:35 1:33 1:32 0:30 1:13 1:30 0:33 1:15 1:16 0:06 1:18 1:28 1:21 0:18 0:35 1:24 0:31 0:21 0:19 1:27 0:24 1:29 0:44 1:58 1:02 1:04 0:37 1:03 0:09 1:12 0:08 0:11 1:08 1:09 0:20 1:06 0:58 1:01 0:39 0:45 0:47 0:16 0:40 0:50 0:41 0:13 0:53 0:38 0:56 0:55 1:11 1:48 1:47 0:59 0:26 1:59 1:17 1:07 1:10 0:52 1:20 1:05 0:51 0:36 0:48 0:46 0:43 0:42 0:28 0:34 0:32 0:29 1:22 0:49 1:23 0:07 1:26 0:54 0:23 0:22 1:57 0:15 0:14 0:12 0:10 0:05 0:04 0:03 0:02 0:01 End 2:00 0:17 0:25 0:57 0:27 1:34 1:31 1:25 1:00
200 Points 200 Points Probability What is the probability that you and your friend choose the same number between 1 and 20 inclusive? • 0.5 • 0.05 • 0.053 • 0.005 • Cannot be determined 1:44 1:55 1:54 1:53 1:49 1:46 1:45 1:43 1:19 1:42 1:50 1:41 1:52 1:40 1:14 1:56 1:51 1:39 1:38 1:37 1:36 1:35 1:33 1:32 0:30 1:13 1:30 0:33 1:15 1:16 0:06 1:18 1:28 1:21 0:18 0:35 1:24 0:31 0:21 0:19 1:27 0:24 1:29 0:44 1:58 1:02 1:04 0:37 1:03 0:09 1:12 0:08 0:11 1:08 1:09 0:20 1:06 0:58 1:01 0:39 0:45 0:47 0:16 0:40 0:50 0:41 0:13 0:53 0:38 0:56 0:55 1:11 1:48 1:47 0:59 0:26 1:59 1:17 1:07 1:10 0:52 1:20 1:05 0:51 0:36 0:48 0:46 0:43 0:42 0:28 0:34 0:32 0:29 1:22 0:49 1:23 0:07 1:26 0:54 0:23 0:22 1:57 0:15 0:14 0:12 0:10 0:05 0:04 0:03 0:02 0:01 End 2:00 0:17 0:25 0:57 0:27 1:34 1:31 1:25 1:00
300 Points 300 Points Probability The probability of randomly choosing someone who is left handed is 0.1. In a group of 15 people, what is the probability that 2 are left handed? • 0.267 • 0.346 • 0.549 • 0.621 • 0.816 1:44 1:55 1:54 1:53 1:49 1:46 1:45 1:43 1:19 1:42 1:50 1:41 1:52 1:40 1:14 1:56 1:51 1:39 1:38 1:37 1:36 1:35 1:33 1:32 0:30 1:13 1:30 0:33 1:15 1:16 0:06 1:18 1:28 1:21 0:18 0:35 1:24 0:31 0:21 0:19 1:27 0:24 1:29 0:44 1:58 1:02 1:04 0:37 1:03 0:09 1:12 0:08 0:11 1:08 1:09 0:20 1:06 0:58 1:01 0:39 0:45 0:47 0:16 0:40 0:50 0:41 0:13 0:53 0:38 0:56 0:55 1:11 1:48 1:47 0:59 0:26 1:59 1:17 1:07 1:10 0:52 1:20 1:05 0:51 0:36 0:48 0:46 0:43 0:42 0:28 0:34 0:32 0:29 1:22 0:49 1:23 0:07 1:26 0:54 0:23 0:22 1:57 0:15 0:14 0:12 0:10 0:05 0:04 0:03 0:02 0:01 End 2:00 0:17 0:25 0:57 0:27 1:34 1:31 1:25 1:00
400 Points 400 Points Bivariate Data The average height of a senior boy is 5’8” with a standard deviation of 3”. The average height of a senior girl is 5’4” with a standard deviation of 2”. When paired up for graduation, what is the probability that the girl is taller than the boy? • 0.032 • 0.084 • 0.134 • 0.189 • 0.212 1:44 1:55 1:54 1:53 1:49 1:46 1:45 1:43 1:19 1:42 1:50 1:41 1:52 1:40 1:14 1:56 1:51 1:39 1:38 1:37 1:36 1:35 1:33 1:32 0:30 1:13 1:30 0:33 1:15 1:16 0:06 1:18 1:28 1:21 0:18 0:35 1:24 0:31 0:21 0:19 1:27 0:24 1:29 0:44 1:58 1:02 1:04 0:37 1:03 0:09 1:12 0:08 0:11 1:08 1:09 0:20 1:06 0:58 1:01 0:39 0:45 0:47 0:16 0:40 0:50 0:41 0:13 0:53 0:38 0:56 0:55 1:11 1:48 1:47 0:59 0:26 1:59 1:17 1:07 1:10 0:52 1:20 1:05 0:51 0:36 0:48 0:46 0:43 0:42 0:28 0:34 0:32 0:29 1:22 0:49 1:23 0:07 1:26 0:54 0:23 0:22 1:57 0:15 0:14 0:12 0:10 0:05 0:04 0:03 0:02 0:01 End 2:00 0:17 0:25 0:57 0:27 1:34 1:31 1:25 1:00
500 Points 500 Points Probability Suppose that 62% of the graduates from a HS go on to 4 yr colleges, 15% go on to 2 yr colleges, 18% find a job, and the remaining graduates search for a job. If a randomly selected student is not going to a 4 yr college, what is the probability that he/she will find employment. • 0.440 • 0.474 • 0.526 • 0.545 • 0.560 1:44 1:55 1:54 1:53 1:49 1:46 1:45 1:43 1:19 1:42 1:50 1:41 1:52 1:40 1:14 1:56 1:51 1:39 1:38 1:37 1:36 1:35 1:33 1:32 0:30 1:13 1:30 0:33 1:15 1:16 0:06 1:18 1:28 1:21 0:18 0:35 1:24 0:31 0:21 0:19 1:27 0:24 1:29 0:44 1:58 1:02 1:04 0:37 1:03 0:09 1:12 0:08 0:11 1:08 1:09 0:20 1:06 0:58 1:01 0:39 0:45 0:47 0:16 0:40 0:50 0:41 0:13 0:53 0:38 0:56 0:55 1:11 1:48 1:47 0:59 0:26 1:59 1:17 1:07 1:10 0:52 1:20 1:05 0:51 0:36 0:48 0:46 0:43 0:42 0:28 0:34 0:32 0:29 1:22 0:49 1:23 0:07 1:26 0:54 0:23 0:22 1:57 0:15 0:14 0:12 0:10 0:05 0:04 0:03 0:02 0:01 End 2:00 0:17 0:25 0:57 0:27 1:34 1:31 1:25 1:00
100 Points 100 Points Inference If you and a friend both randomly choose a number between 1 and 20 inclusive, what is the probability that you pick the same number? • 0.5 • 0.05 • 0.053 • 0.005 • Cannot be determined 1:44 1:55 1:54 1:53 1:49 1:46 1:45 1:43 1:19 1:42 1:50 1:41 1:52 1:40 1:14 1:56 1:51 1:39 1:38 1:37 1:36 1:35 1:33 1:32 0:30 1:13 1:30 0:33 1:15 1:16 0:06 1:18 1:28 1:21 0:18 0:35 1:24 0:31 0:21 0:19 1:27 0:24 1:29 0:44 1:58 1:02 1:04 0:37 1:03 0:09 1:12 0:08 0:11 1:08 1:09 0:20 1:06 0:58 1:01 0:39 0:45 0:47 0:16 0:40 0:50 0:41 0:13 0:53 0:38 0:56 0:55 1:11 1:48 1:47 0:59 0:26 1:59 1:17 1:07 1:10 0:52 1:20 1:05 0:51 0:36 0:48 0:46 0:43 0:42 0:28 0:34 0:32 0:29 1:22 0:49 1:23 0:07 1:26 0:54 0:23 0:22 1:57 0:15 0:14 0:12 0:10 0:05 0:04 0:03 0:02 0:01 End 2:00 0:17 0:25 0:57 0:27 1:34 1:31 1:25 1:00
200 Points 200 Points Experiments/Sampling The purpose of blocking in experimental design is to ___________ Hint: matched pair is a type of blocking • Control for confounding variables • Control for experimenter bias • Replicate the experiment • Control for lurking variables • Incorporate blinding 1:44 1:55 1:54 1:53 1:49 1:46 1:45 1:43 1:19 1:42 1:50 1:41 1:52 1:40 1:14 1:56 1:51 1:39 1:38 1:37 1:36 1:35 1:33 1:32 0:30 1:13 1:30 0:33 1:15 1:16 0:06 1:18 1:28 1:21 0:18 0:35 1:24 0:31 0:21 0:19 1:27 0:24 1:29 0:44 1:58 1:02 1:04 0:37 1:03 0:09 1:12 0:08 0:11 1:08 1:09 0:20 1:06 0:58 1:01 0:39 0:45 0:47 0:16 0:40 0:50 0:41 0:13 0:53 0:38 0:56 0:55 1:11 1:48 1:47 0:59 0:26 1:59 1:17 1:07 1:10 0:52 1:20 1:05 0:51 0:36 0:48 0:46 0:43 0:42 0:28 0:34 0:32 0:29 1:22 0:49 1:23 0:07 1:26 0:54 0:23 0:22 1:57 0:15 0:14 0:12 0:10 0:05 0:04 0:03 0:02 0:01 End 2:00 0:17 0:25 0:57 0:27 1:34 1:31 1:25 1:00
300 Points 300 Points Experiments/Sampling Mr. DeMaio wants to collect a sample of 50 PV students. To keep the sample proportions equal to the population proportions, he samples 12 seniors, 14 juniors, 13 sophomores, & 11 freshmen. What type of sampling method was used? • Simple Random • Systematic • Stratified • Cluster • Convenience 1:44 1:55 1:54 1:53 1:49 1:46 1:45 1:43 1:19 1:42 1:50 1:41 1:52 1:40 1:14 1:56 1:51 1:39 1:38 1:37 1:36 1:35 1:33 1:32 0:30 1:13 1:30 0:33 1:15 1:16 0:06 1:18 1:28 1:21 0:18 0:35 1:24 0:31 0:21 0:19 1:27 0:24 1:29 0:44 1:58 1:02 1:04 0:37 1:03 0:09 1:12 0:08 0:11 1:08 1:09 0:20 1:06 0:58 1:01 0:39 0:45 0:47 0:16 0:40 0:50 0:41 0:13 0:53 0:38 0:56 0:55 1:11 1:48 1:47 0:59 0:26 1:59 1:17 1:07 1:10 0:52 1:20 1:05 0:51 0:36 0:48 0:46 0:43 0:42 0:28 0:34 0:32 0:29 1:22 0:49 1:23 0:07 1:26 0:54 0:23 0:22 1:57 0:15 0:14 0:12 0:10 0:05 0:04 0:03 0:02 0:01 End 2:00 0:17 0:25 0:57 0:27 1:34 1:31 1:25 1:00
400 Points 400 Points Experiments/Sampling • Which of the statements describes good practices when designing experiments? • Control the effects of confounding variables • Replicate to increase variation from treatments • Randomize to ensure that an effect is observed. • I only • I and II • I and III • II only • I, II, and III 1:44 1:55 1:54 1:53 1:49 1:46 1:45 1:43 1:19 1:42 1:50 1:41 1:52 1:40 1:14 1:56 1:51 1:39 1:38 1:37 1:36 1:35 1:33 1:32 0:30 1:13 1:30 0:33 1:15 1:16 0:06 1:18 1:28 1:21 0:18 0:35 1:24 0:31 0:21 0:19 1:27 0:24 1:29 0:44 1:58 1:02 1:04 0:37 1:03 0:09 1:12 0:08 0:11 1:08 1:09 0:20 1:06 0:58 1:01 0:39 0:45 0:47 0:16 0:40 0:50 0:41 0:13 0:53 0:38 0:56 0:55 1:11 1:48 1:47 0:59 0:26 1:59 1:17 1:07 1:10 0:52 1:20 1:05 0:51 0:36 0:48 0:46 0:43 0:42 0:28 0:34 0:32 0:29 1:22 0:49 1:23 0:07 1:26 0:54 0:23 0:22 1:57 0:15 0:14 0:12 0:10 0:05 0:04 0:03 0:02 0:01 End 2:00 0:17 0:25 0:57 0:27 1:34 1:31 1:25 1:00
500 Points 500 Points Experiments/Sampling • Which of the following best describes the goal of sampling? • Produce an average sample • Choose the average representatives • Produce a representative sample • I only • II only • I & II • III only • I and III 1:44 1:55 1:54 1:53 1:49 1:46 1:45 1:43 1:19 1:42 1:50 1:41 1:52 1:40 1:14 1:56 1:51 1:39 1:38 1:37 1:36 1:35 1:33 1:32 0:30 1:13 1:30 0:33 1:15 1:16 0:06 1:18 1:28 1:21 0:18 0:35 1:24 0:31 0:21 0:19 1:27 0:24 1:29 0:44 1:58 1:02 1:04 0:37 1:03 0:09 1:12 0:08 0:11 1:08 1:09 0:20 1:06 0:58 1:01 0:39 0:45 0:47 0:16 0:40 0:50 0:41 0:13 0:53 0:38 0:56 0:55 1:11 1:48 1:47 0:59 0:26 1:59 1:17 1:07 1:10 0:52 1:20 1:05 0:51 0:36 0:48 0:46 0:43 0:42 0:28 0:34 0:32 0:29 1:22 0:49 1:23 0:07 1:26 0:54 0:23 0:22 1:57 0:15 0:14 0:12 0:10 0:05 0:04 0:03 0:02 0:01 End 2:00 0:17 0:25 0:57 0:27 1:34 1:31 1:25 1:00
100 Points 100 Points Inference If all other values are held constant, which of the following is true of a confidence interval if the sample size is increased? • The margin of error will decrease • The sample mean will increase • The margin of error will increase • The population mean will increase • The sample variability will decrease 1:44 1:55 1:54 1:53 1:49 1:46 1:45 1:43 1:19 1:42 1:50 1:41 1:52 1:40 1:14 1:56 1:51 1:39 1:38 1:37 1:36 1:35 1:33 1:32 0:30 1:13 1:30 0:33 1:15 1:16 0:06 1:18 1:28 1:21 0:18 0:35 1:24 0:31 0:21 0:19 1:27 0:24 1:29 0:44 1:58 1:02 1:04 0:37 1:03 0:09 1:12 0:08 0:11 1:08 1:09 0:20 1:06 0:58 1:01 0:39 0:45 0:47 0:16 0:40 0:50 0:41 0:13 0:53 0:38 0:56 0:55 1:11 1:48 1:47 0:59 0:26 1:59 1:17 1:07 1:10 0:52 1:20 1:05 0:51 0:36 0:48 0:46 0:43 0:42 0:28 0:34 0:32 0:29 1:22 0:49 1:23 0:07 1:26 0:54 0:23 0:22 1:57 0:15 0:14 0:12 0:10 0:05 0:04 0:03 0:02 0:01 End 2:00 0:17 0:25 0:57 0:27 1:34 1:31 1:25 1:00
200 Points 200 Points Inference In a survey of 550 students, 260 stated that they had worked during the summer break. In the same survey last year, 300 of 610 stated the same. Which type of test should be used to determine if the difference is statistically significant? • A matched pair t test • A one sample t test • A 1 proportion z test • A 2 sample t test • A 2 proportion z test 1:44 1:55 1:54 1:53 1:45 1:49 1:46 1:52 1:50 1:19 1:43 1:42 1:41 1:40 0:33 0:19 1:09 0:58 1:11 1:56 1:51 1:39 1:38 1:37 1:36 1:35 1:32 1:15 1:29 1:28 1:27 1:24 1:21 1:01 1:16 0:31 1:14 1:13 1:18 1:12 1:30 0:30 1:33 1:08 0:24 0:53 0:50 0:41 0:40 0:47 0:45 1:58 0:39 0:56 1:02 1:03 1:04 1:06 0:44 0:55 0:20 0:37 0:16 0:13 0:11 0:18 0:08 0:06 0:35 0:38 0:21 0:09 1:48 1:47 1:20 1:26 1:25 0:46 0:43 1:23 1:17 1:22 0:42 1:59 1:00 0:59 1:10 1:31 0:32 0:27 2:00 0:29 0:28 0:48 0:36 0:49 0:10 0:51 0:57 0:22 1:05 0:17 0:15 0:14 0:12 0:52 1:07 0:07 1:57 0:05 0:04 0:03 0:02 0:01 End 0:23 1:34 0:25 0:26 0:54 0:34
300 Points 300 Points Inference The mean weight of 120 male high school students is 156 lbs with a standard deviation of 23 lbs. Which test should be used to determine whether the mean weight of all high school seniors is more than 150 lbs? • A matched pair t test • A one sample t test • A 1 proportion z test • A 2 sample t test • A 2 proportion z test 1:44 1:55 1:54 1:53 1:45 1:49 1:46 1:52 1:50 1:19 1:43 1:42 1:41 1:40 0:33 0:19 1:09 0:58 1:11 1:56 1:51 1:39 1:38 1:37 1:36 1:35 1:32 1:15 1:29 1:28 1:27 1:24 1:21 1:01 1:16 0:31 1:14 1:13 1:18 1:12 1:30 0:30 1:33 1:08 0:24 0:53 0:50 0:41 0:40 0:47 0:45 1:58 0:39 0:56 1:02 1:03 1:04 1:06 0:44 0:55 0:20 0:37 0:16 0:13 0:11 0:18 0:08 0:06 0:35 0:38 0:21 0:09 1:48 1:47 1:20 1:26 1:25 0:46 0:43 1:23 1:17 1:22 0:42 1:59 1:00 0:59 1:10 1:31 0:32 0:27 2:00 0:29 0:28 0:48 0:36 0:49 0:10 0:51 0:57 0:22 1:05 0:17 0:15 0:14 0:12 0:52 1:07 0:07 1:57 0:05 0:04 0:03 0:02 0:01 End 0:23 1:34 0:25 0:26 0:54 0:34
400 Points 400 Points Inference • Which of the following statements is true? • The null hypothesis is stated in terms of a population paramenter • The alternative hypothesis is stated in terms of a sample statistic • The larger the p-value the weaker the evidence against the null hypothesis • I & II • I & III • III only • I, II, & III • None 1:44 1:55 1:54 1:53 1:45 1:49 1:46 1:52 1:50 1:19 1:43 1:42 1:41 1:40 0:33 0:19 1:09 0:58 1:11 1:56 1:51 1:39 1:38 1:37 1:36 1:35 1:32 1:15 1:29 1:28 1:27 1:24 1:21 1:01 1:16 0:31 1:14 1:13 1:18 1:12 1:30 0:30 1:33 1:08 0:24 0:53 0:50 0:41 0:40 0:47 0:45 1:58 0:39 0:56 1:02 1:03 1:04 1:06 0:44 0:55 0:20 0:37 0:16 0:13 0:11 0:18 0:08 0:06 0:35 0:38 0:21 0:09 1:48 1:47 1:20 1:26 1:25 0:46 0:43 1:23 1:17 1:22 0:42 1:59 1:00 0:59 1:10 1:31 0:32 0:27 2:00 0:29 0:28 0:48 0:36 0:49 0:10 0:51 0:57 0:22 1:05 0:17 0:15 0:14 0:12 0:52 1:07 0:07 1:57 0:05 0:04 0:03 0:02 0:01 End 0:23 1:34 0:25 0:26 0:54 0:34
500 Points 500 Points Inference 1:44 1:45 1:46 1:55 1:54 1:53 1:49 1:40 1:19 1:52 1:41 1:43 1:42 1:50 1:29 0:33 0:35 0:38 1:11 1:02 1:33 1:35 1:37 1:12 1:32 1:30 1:28 1:58 1:27 1:51 1:36 1:56 1:24 1:13 0:31 1:14 1:15 1:18 1:21 1:16 1:39 0:30 1:38 1:09 0:24 0:53 0:55 0:47 0:45 0:44 0:41 0:56 0:58 1:01 1:03 1:04 1:06 0:50 0:18 0:19 0:20 0:16 0:11 0:09 0:13 0:06 0:37 0:21 0:39 0:40 0:08 1:08 1:48 1:47 0:54 0:52 1:23 0:32 0:57 1:20 0:51 0:59 1:22 0:49 0:36 1:25 0:46 1:26 0:43 0:42 1:31 0:34 1:34 1:00 0:48 0:01 0:05 1:05 0:28 0:10 0:26 0:25 0:02 0:23 0:22 0:03 2:00 0:17 0:07 0:15 1:59 0:14 0:12 1:57 0:04 0:27 1:10 0:29 1:07 1:17 End
100 Points 100 Points “Random” A 95% confidence interval for the true slope of a regression line is (-3.38,-0.936). Which of the following is the point estimate for the slope? • -0.936 • -2.157 • -2.442 • -3.378 • -4.314 1:44 1:55 1:54 1:53 1:45 1:49 1:46 1:52 1:50 1:19 1:43 1:42 1:41 1:40 0:33 0:19 1:09 0:58 1:11 1:56 1:51 1:39 1:38 1:37 1:36 1:35 1:32 1:15 1:29 1:28 1:27 1:24 1:21 1:01 1:16 0:31 1:14 1:13 1:18 1:12 1:30 0:30 1:33 1:08 0:24 0:53 0:50 0:41 0:40 0:47 0:45 1:58 0:39 0:56 1:02 1:03 1:04 1:06 0:44 0:55 0:20 0:37 0:16 0:13 0:11 0:18 0:08 0:06 0:35 0:38 0:21 0:09 1:48 1:47 1:20 1:26 1:25 0:46 0:43 1:23 1:17 1:22 0:42 1:59 1:00 0:59 1:10 1:31 0:32 0:27 2:00 0:29 0:28 0:48 0:36 0:49 0:10 0:51 0:57 0:22 1:05 0:17 0:15 0:14 0:12 0:52 1:07 0:07 1:57 0:05 0:04 0:03 0:02 0:01 End 0:23 1:34 0:25 0:26 0:54 0:34
200 Points 200 Points “Random” Students are comparing the grade distributions of three professors who teach the same course. Which test would they employ? • Chi Square test for independence • Chi Square test for goodness of fit • Chi Square test for homogeneity • t-test • None of the above 1:44 1:55 1:54 1:53 1:45 1:49 1:46 1:52 1:50 1:19 1:43 1:42 1:41 1:40 0:33 0:19 1:09 0:58 1:11 1:56 1:51 1:39 1:38 1:37 1:36 1:35 1:32 1:15 1:29 1:28 1:27 1:24 1:21 1:01 1:16 0:31 1:14 1:13 1:18 1:12 1:30 0:30 1:33 1:08 0:24 0:53 0:50 0:41 0:40 0:47 0:45 1:58 0:39 0:56 1:02 1:03 1:04 1:06 0:44 0:55 0:20 0:37 0:16 0:13 0:11 0:18 0:08 0:06 0:35 0:38 0:21 0:09 1:48 1:47 1:20 1:26 1:25 0:46 0:43 1:23 1:17 1:22 0:42 1:59 1:00 0:59 1:10 1:31 0:32 0:27 2:00 0:29 0:28 0:48 0:36 0:49 0:10 0:51 0:57 0:22 1:05 0:17 0:15 0:14 0:12 0:52 1:07 0:07 1:57 0:05 0:04 0:03 0:02 0:01 End 0:23 1:34 0:25 0:26 0:54 0:34
300 Points 300 Points “Random” A researcher wishes to study the effects of diet on weight loss. He recruits 60 overweight subjects to participate in the study and records their gender. He also randomly assigns three different diet and exercise regimens to the subjects. Which of the following describes appropriate blocking techniques? • Block on gender • Block on diet • Block on exercise • Both B & C • A, B, & C 1:44 1:55 1:54 1:53 1:45 1:49 1:46 1:52 1:50 1:19 1:43 1:42 1:41 1:40 0:33 0:19 1:09 0:58 1:11 1:56 1:51 1:39 1:38 1:37 1:36 1:35 1:32 1:15 1:29 1:28 1:27 1:24 1:21 1:01 1:16 0:31 1:14 1:13 1:18 1:12 1:30 0:30 1:33 1:08 0:24 0:53 0:50 0:41 0:40 0:47 0:45 1:58 0:39 0:56 1:02 1:03 1:04 1:06 0:44 0:55 0:20 0:37 0:16 0:13 0:11 0:18 0:08 0:06 0:35 0:38 0:21 0:09 1:48 1:47 1:20 1:26 1:25 0:46 0:43 1:23 1:17 1:22 0:42 1:59 1:00 0:59 1:10 1:31 0:32 0:27 2:00 0:29 0:28 0:48 0:36 0:49 0:10 0:51 0:57 0:22 1:05 0:17 0:15 0:14 0:12 0:52 1:07 0:07 1:57 0:05 0:04 0:03 0:02 0:01 End 0:23 1:34 0:25 0:26 0:54 0:34
400 Points 400 Points “Random” • Which of the following statements are true? • The range of the sample data set can never be greater than the range of the population. • While the range is affected by outliers, the interquartile range is not. • Changing the order from ascending to descending changes the sign of the range. • I only • II only • III only • I and II • I and III 1:44 1:55 1:54 1:53 1:45 1:49 1:46 1:52 1:50 1:19 1:43 1:42 1:41 1:40 0:33 0:19 1:09 0:58 1:11 1:56 1:51 1:39 1:38 1:37 1:36 1:35 1:32 1:15 1:29 1:28 1:27 1:24 1:21 1:01 1:16 0:31 1:14 1:13 1:18 1:12 1:30 0:30 1:33 1:08 0:24 0:53 0:50 0:41 0:40 0:47 0:45 1:58 0:39 0:56 1:02 1:03 1:04 1:06 0:44 0:55 0:20 0:37 0:16 0:13 0:11 0:18 0:08 0:06 0:35 0:38 0:21 0:09 1:48 1:47 1:20 1:26 1:25 0:46 0:43 1:23 1:17 1:22 0:42 1:59 1:00 0:59 1:10 1:31 0:32 0:27 2:00 0:29 0:28 0:48 0:36 0:49 0:10 0:51 0:57 0:22 1:05 0:17 0:15 0:14 0:12 0:52 1:07 0:07 1:57 0:05 0:04 0:03 0:02 0:01 End 0:23 1:34 0:25 0:26 0:54 0:34
500 Points 500 Points “Random” • Increasing your sample size in a hypothesis test: • I. Decreases the probability of a Type I Error • Decreases the probability of a Type II Error • Increases the Power of the test • I only • II only • I & III • II & III • I, II, & III 1:44 1:55 1:54 1:53 1:45 1:49 1:46 1:52 1:50 1:19 1:43 1:42 1:41 1:40 0:33 0:19 1:09 0:58 1:11 1:56 1:51 1:39 1:38 1:37 1:36 1:35 1:32 1:15 1:29 1:28 1:27 1:24 1:21 1:01 1:16 0:31 1:14 1:13 1:18 1:12 1:30 0:30 1:33 1:08 0:24 0:53 0:50 0:41 0:40 0:47 0:45 1:58 0:39 0:56 1:02 1:03 1:04 1:06 0:44 0:55 0:20 0:37 0:16 0:13 0:11 0:18 0:08 0:06 0:35 0:38 0:21 0:09 1:48 1:47 1:20 1:26 1:25 0:46 0:43 1:23 1:17 1:22 0:42 1:59 1:00 0:59 1:10 1:31 0:32 0:27 2:00 0:29 0:28 0:48 0:36 0:49 0:10 0:51 0:57 0:22 1:05 0:17 0:15 0:14 0:12 0:52 1:07 0:07 1:57 0:05 0:04 0:03 0:02 0:01 End 0:23 1:34 0:25 0:26 0:54 0:34