Download
1 / 11
110 likes | 227 Vues
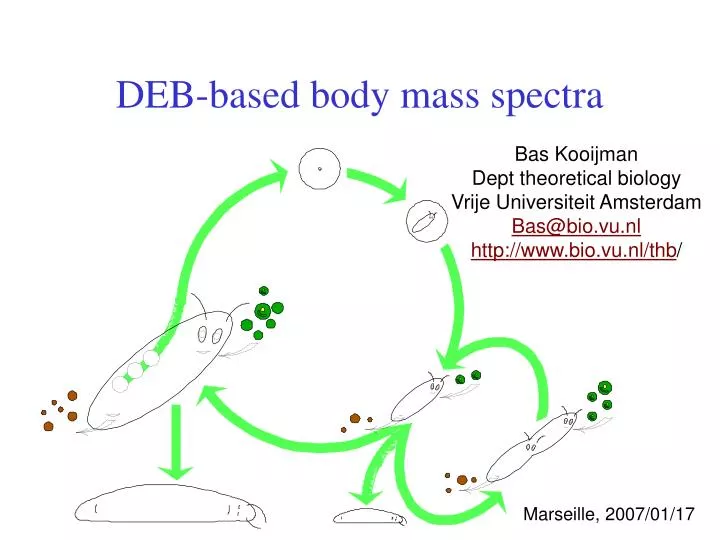
DEB-based body mass spectra. Bas Kooijman Dept theoretical biology Vrije Universiteit Amsterdam Bas@bio.vu.nl http://www.bio.vu.nl/thb /. Marseille, 2007/01/17. Body mass spectrum. Derive it from:. Primary scaling relationships.

E N D
DEB-based body mass spectra Bas Kooijman Dept theoretical biology Vrije Universiteit Amsterdam Bas@bio.vu.nl http://www.bio.vu.nl/thb/ Marseille, 2007/01/17
Body mass spectrum Derive it from:
Primary scaling relationships assimilation {JEAm} max surface-specific assim rate Lm feeding {b} surface- specific searching rate digestion yEX yield of reserve on food growth yVEyield of structure on reserve mobilization v energy conductance heating,osmosis {JET} surface-specific somatic maint. costs turnover,activity [JEM] volume-specific somatic maint. costs regulation,defence kJ maturity maintenance rate coefficient allocation partitioning fraction egg formation R reproduction efficiency life cycle [MHb] volume-specific maturity at birth life cycle [MHp] volume-specific maturity at puberty aging ha aging acceleration Kooijman 1986 J. Theor. Biol. 121: 269-282 maximum length Lm = {JEAm} / [JEM]
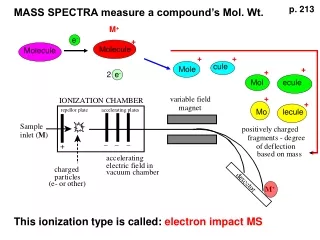
Metabolic rate 8.2.2 slope = 1 Log metabolic rate, w O2 consumption, l/h 2 curves fitted: endotherms 0.0226 L2 + 0.0185 L3 0.0516 L2.44 ectotherms slope = 2/3 unicellulars Log weight, g Length, cm Intra-species Inter-species (Daphnia pulex)
Feeding rate 8.2.2 slope = 1 Filtration rate, l/h Mytilus edulis Data: Winter 1973 poikilothermic tetrapods Data: Farlow 1976 Length, cm Inter-species: JXm V Intra-species: JXm V2/3
Spectrum definition • individuals follow standard DEB model in homogeneous environment • kM = kJ; no reproduction buffer • max lengths represent random trials from exponential distribution • individuals eat other individuals in length-range linked to own length • background mortality has constant hazard rate • individuals with length below threshold feed on producers (constant) • individuals with length below threshold feed on producers+consumers • with a linear preference shift between the two thresholds
Trials from exponential distribution Suppose that mean = 1, else multiply result by mean Expected value of the i-th ordered trial from a sample of size k
Canonical community 9.4 Short time scale: Mass recycling in a community closed for mass open for energy Long time scale: Nutrients leaks and influxes Memory is controlled by life span (links to body size) Spatial coherence is controlled by transport (links to body size)