Download
1 / 1
10 likes | 139 Vues
DEVELOPMENT AND VALIDATION OF A UPLC/MS/MS METHOD FOR THE ANALYSIS OF OXYTETRACYCLINE IN NASAL SECRETIONS AND PLASMA OF HEALTHY PIGS M.A. Bimazubute & , E. Rozet # , J.-Cl. Van Heugen £ , E. Arancio £ , J. Crommen $ , P. Gustin & and P. Chiap £

E N D
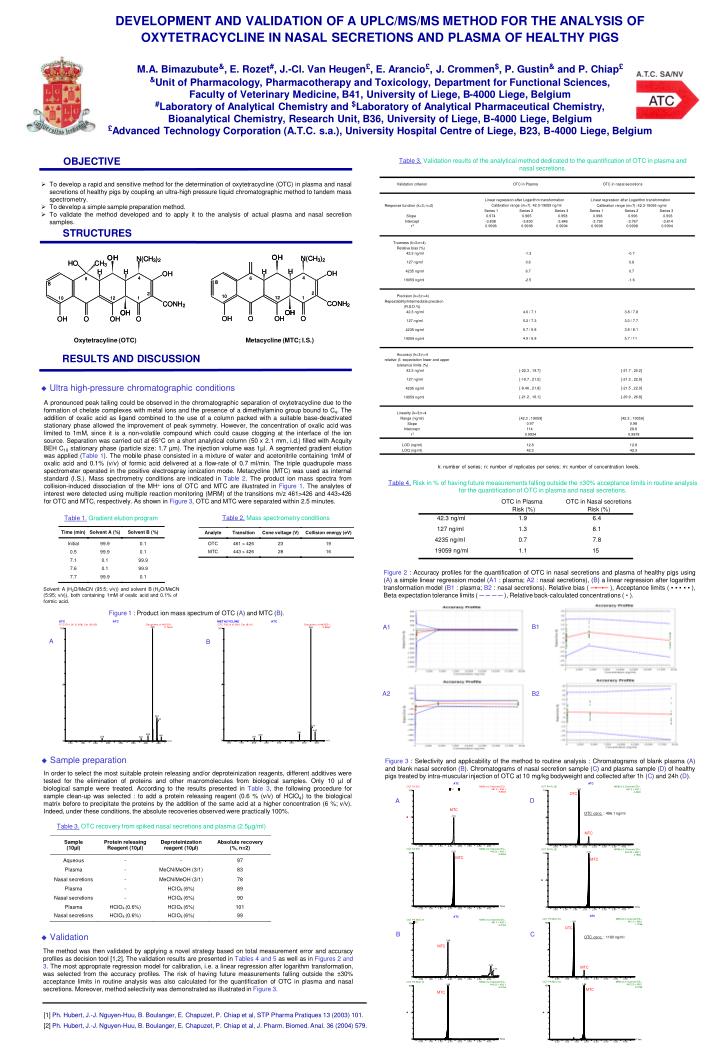
DEVELOPMENT AND VALIDATION OF A UPLC/MS/MS METHOD FOR THE ANALYSIS OF OXYTETRACYCLINE IN NASAL SECRETIONS AND PLASMA OF HEALTHY PIGS M.A. Bimazubute&, E. Rozet#, J.-Cl. Van Heugen£, E. Arancio£, J. Crommen$, P. Gustin& and P. Chiap£ &Unit of Pharmacology, Pharmacotherapy and Toxicology, Department for Functional Sciences, Faculty of Veterinary Medicine, B41, University of Liege, B-4000 Liege, Belgium #Laboratory of Analytical Chemistry and $Laboratory of Analytical Pharmaceutical Chemistry, Bioanalytical Chemistry, Research Unit, B36, University of Liege, B-4000 Liege, Belgium £Advanced Technology Corporation (A.T.C. s.a.), University Hospital Centre of Liege, B23, B-4000 Liege, Belgium Table 3. Validation results of the analytical method dedicated to the quantification of OTC in plasma and nasal secretions. OBJECTIVE • To develop a rapid and sensitive method for the determination of oxytetracycline (OTC) in plasma and nasal secretions of healthy pigs by coupling an ultra-high pressure liquid chromatographic method to tandem mass spectrometry. • To develop a simple sample preparation method. • To validate the method developed and to apply it to the analysis of actual plasma and nasal secretion samples. STRUCTURES Oxytetracyline (OTC) Metacycline (MTC; I.S.) RESULTS AND DISCUSSION • Ultra high-pressure chromatographic conditions A pronounced peak tailing could be observed in the chromatographic separation of oxytetracycline due to the formation of chelate complexes with metal ions and the presence of a dimethylamino group bound to C4. The addition of oxalic acid as ligand combined to the use of a column packed with a suitable base-deactivated stationary phase allowed the improvement of peak symmetry. However, the concentration of oxalic acid was limited to 1mM, since it is a non-volatile compound which could cause clogging at the interface of the ion source. Separation was carried out at 65°C on a short analytical column (50 x 2.1 mm, i.d.) filled with Acquity BEH C18 stationary phase (particle size: 1.7 µm). The injection volume was 1µl. A segmented gradient elution was applied (Table 1). The mobile phase consisted in a mixture of water and acetonitrile containing 1mM of oxalic acid and 0.1% (v/v) of formic acid delivered at a flow-rate of 0.7 ml/min. The triple quadrupole mass spectrometer operated in the positive electrospray ionization mode. Metacycline (MTC) was used as internal standard (I.S.). Mass spectrometry conditions are indicated in Table 2. The product ion mass spectra from collision-induced dissociation of the MH+ ions of OTC and MTC are illustrated in Figure 1. The analytes of interest were detected using multiple reaction monitoring (MRM) of the transitions m/z 461>426 and 443>426 for OTC and MTC, respectively. As shown in Figure 3, OTC and MTC were separated within 2.5 minutes. k: number of series; n: number of replicates per series; m: number of concentration levels. Table 4. Risk in % of having future measurements falling outside the ±30% acceptance limits in routine analysis for the quantification of OTC in plasma and nasal secretions. Table 2.Mass spectrometry conditions Table 1.Gradient elution program Figure 2 : Accuracy profiles for the quantification of OTC in nasal secretions and plasma of healthy pigs using (A) a simple linear regression model(A1 : plasma; A2 : nasal secretions), (B) a linear regression after logarithm transformation model (B1 : plasma; B2 : nasal secretions). Relative bias ( ─▪─▪─ ), Acceptance limits ( ▪ ▪ ▪ ▪ ▪ ), Beta expectation tolerance limits ( ─ ─ ─ ─ ), Relative back-calculated concentrations ( ▪ ). Solvent A (H2O/MeCN (95:5; v/v)) and solvent B (H2O/MeCN (5:95; v/v)), both containing 1mM of oxalic acid and 0.1% of formic acid. Figure 1 : Product ion mass spectrum of OTC (A) and MTC (B). B1 A1 A B A2 B2 • Sample preparation Figure 3 : Selectivity and applicability of the method to routine analysis : Chromatograms of blank plasma (A) and blank nasal secretion (B). Chromatograms of nasal secretion sample (C) and plasma sample (D) of healthy pigs treated by intra-muscular injection of OTC at 10 mg/kg bodyweight and collected after 1h (C) and 24h (D). In order to select the most suitable protein releasing and/or deproteinization reagents, different additives were tested for the elimination of proteins and other macromolecules from biological samples. Only 10 µl of biological sample were treated. According to the results presented in Table 3, the following procedure for sample clean-up was selected : to add a protein releasing reagent (0.6 % (v/v) of HClO4) to the biological matrix before to precipitate the proteins by the addition of the same acid at a higher concentration (6 %; v/v). Indeed, under these conditions, the absolute recoveries observed were practically 100%. OTC D A OTC conc. : 496.1 ng/ml MTC Table 3. OTC recovery from spiked nasal secretions and plasma (2.5µg/ml) MTC MTC MTC OTC B C • Validation OTC conc. : 1160 ng/ml The method was then validated by applying a novel strategy based on total measurement error and accuracy profiles as decision tool [1,2]. The validation results are presented in Tables 4 and 5 as well as in Figures 2 and 3. The most appropriate regression model for calibration, i.e. a linear regression after logarithm transformation, was selected from the accuracy profiles. The risk of having future measurements falling outside the ±30% acceptance limits in routine analysis was also calculated for the quantification of OTC in plasma and nasal secretions. Moreover, method selectivity was demonstrated as illustrated in Figure 3. MTC MTC MTC MTC [1] Ph. Hubert, J.-J. Nguyen-Huu, B. Boulanger, E. Chapuzet, P. Chiap et al, STP Pharma Pratiques 13 (2003) 101. [2] Ph. Hubert, J.-J. Nguyen-Huu, B. Boulanger, E. Chapuzet, P. Chiap et al, J. Pharm. Biomed. Anal. 36 (2004) 579.