Download
1 / 28
280 likes | 382 Vues
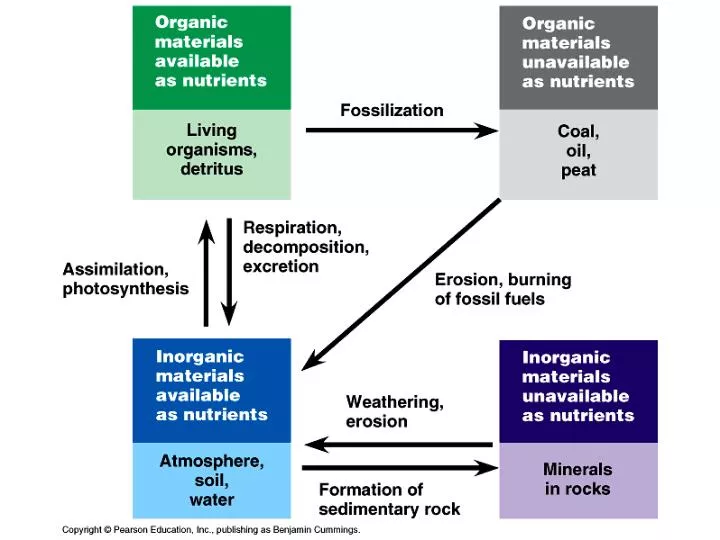
Figure 51.1. External energy source. PRIMARY PRODUCERS. CONSUMERS. DECOMPOSERS. ABIOTIC ENVIRONMENT. Figure 54-14. THE GLOBAL CARBON CYCLE. All values in gigatons of carbon per year. Atmosphere: 778 (during 1990s). Net uptake via photosynthesis by plants: 3.0. Land-use change

E N D
Figure 51.1 External energy source PRIMARY PRODUCERS CONSUMERS DECOMPOSERS ABIOTIC ENVIRONMENT
Figure 54-14 THE GLOBAL CARBON CYCLE All values in gigatons of carbon per year Atmosphere: 778 (during 1990s) Net uptake via photosynthesis by plants: 3.0 Land-use change (primarily deforestation): 1.6 Net uptake via photosynthesis, chemical processes: 1.5 Fossil-fuel use: 6.3 Organisms, soil, litter, peat: 2190 Rivers (erosion): 0.8 Organisms, chemical processes in ocean: 40,000 Terrestrial ecosystems Aquatic ecosystems Human-induced changes
Figure 51.12a 1860 1880 1900 1920 1940 1960 1980 Human-induced increases in CO2 flux over time 6 5 4 3 2 1 0 Fossil fuel use Annual flux of carbon (1015g) Land use Year
Figure 51.12b 360 350 340 330 320 310 Atmospheric CO2 CO2 concentration (ppm) 1960 1970 1980 1990 Year
Figure 51.3b Marine productivity <35 35–55 55–90 >90 Productivity ranges (g/m2/yr)
Figure 51.3a Terrestrial productivity 0–100 100–200 200–400 400–600 600–800 >800 Productivity ranges (g/m2/yr)
Figure 54-2 Net primary productivity (kgC/m2/year) 3 2 1 0
Figure 54-3 Area covered, by ecosystem type NPP per unit area Total NPP Aquatic Terrestrial
Figure 54-16 THE GLOBAL NITROGEN CYCLE All values in gigatons of nitrogen per year Atmospheric nitrogen (N2) Industrial fixation: 100 Protein and nucleic acid synthesis Bacteria in mud use N-containing molecules as energy sources, excrete N2: 310 Lightning and rain: 3 Internal cycling: 1200 Nitrogen-fixing bacteria in roots and soil: 202 Nitrogen-fixing cyanobacteria: 15 Internal cycling: 8000 Runoff: 36 Decomposition of detritus into ammonia Mud Permanent burial: 10